Schools: Back to square one?

posted in: Map Improvements, Participate | 4

January 1st marked the beginning of our fifth OpenStreetMap quarterly project – schools. After 18 days we return back to square one. So what’s been going on?

The UK Quarterly Projects are intended as a bit of fun designed to inspire a few edits to OpenStreetMap in peoples spare time. Hopefully they also help with the sense of community and attract a few new people to OpenStreetMap. Our fifth project is all about schools.

One of the methods we use to track progress is a daily count of the total number of schools mapped in OpenStreetMap. This is based on the data reported by TagInfo and the data is collected daily thanks to a script written by Adam Hoyle.

UK schools mapped in OpenStreetMap - back to square one?
UK schools mapped in OpenStreetMap – back to square one?

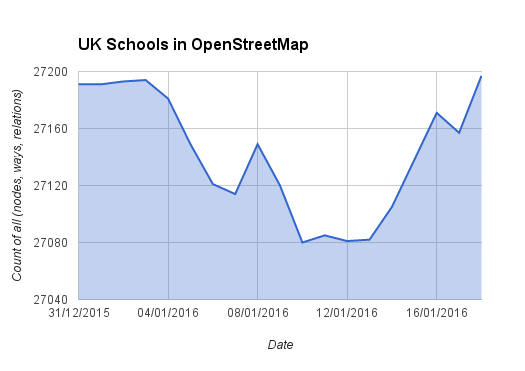
Normally we would expect to see the graph trend upwards, but with the schools project we started with an initial dip, having only just returned to square one. Why?

Well all is not bad. The chart above hides a lot of progress that has been made. Thanks to early work by Frederik and a uMap produced by Jerry, there has been a big focus on improving the mapping of existing schools. In many cases this meant converting a simple node (point marking the centre of the school) to a way (polygon) demarking the boundary of the school. The chart unfortunately misses these! There were also many cases where a school had been marked with both a node and a way. This is considered bad practice and the drop in the chart reflects how people have been cleaning this up.

We see that a hugely impressive 137 people have been helping to map schools in OpenStreetMap, editing a total of 3,300 schools!

So what progress has been made? To answer this we can refer to a number of new progress trackers. Firstly Harry Wood‘s school edit tracker. This counts the number of UK school edits that have been made. We see that a hugely impressive 137 people have been helping to map schools in OpenStreetMap, editing a total of 3,300 schools! For fun Harry’s tool also provides a leader board – congratulations to Robert W, Paul (southglos) and Mark S for taking 1st, 2nd and 3rd respectively.

We can also track progress by postcode region thanks to Robert W’s comparison tool. In my previous post we looked at how the KY postcode area was leading the way. Overall we have now increased the number of schools mapped in OpenStreetMap from 62% to 68% (excludes Northern Ireland data as this was added later). If we continue at this rate we will reach a massive 90% by the end of the quarter. I think we can get closer to 100% as the pace will pick up now that the initial clean up of existing data is coming to an end. 🙂

Up for the challenge? To join us in adding schools to OpenStreetMap see here. Never mapped before? No worries, contact us for a helping hand.


Towards a real-time map?

posted in: Map Improvements | 1

Birmingham City Council has started rolling out a speed limit reduction on many residential roads and in some local centres to 20mph. This presents a great opportunity for local OpenStreetMap mappers to demonstrate the power of OpenStreetMap in keeping pace with the speed limit reduction programme as it progresses.

Phase 1 covers parts of central, south and east Birmingham. The scheme will install signs and lines only – no new traffic calming (e.g. speed bumps) will be introduced as part of this scheme. Road signs and markings will be installed from December 2015 to March 2016 and the speed limit will come into effect once works are complete.

20mph is part of a broader package of measures aimed to give people, especially children, more confidence to walk and cycle. Over the next 5 years the Council intends to put 20mph speed limits on 90% of Birmingham’s roads. Most main roads will keep their existing 30mph or 40mph speed limits.

20 mph zones are starting to be rolled out across Birmingham and we are keeping OpenStreetMap up to date.

According to Council consultation in the areas covered, 49 per cent of people were in favour of 20mph limits and 35 per cent opposed. Council data show that the minor roads (mainly residential) in this particular scheme were the location for 508 casualties, including 68 deaths or serious injuries between 2011 and 2013. That is roughly one casualty every two days.

OpenStreetMap locally has worked with Birmingham City Council Transportation over the past year to understand how we could achieve a “realtime mapping” of the changes.

The Council estimate related annual costs from injuries, hospital and ambulance services, would reduce by up to £870,000. The total cost is £1.025m, with almost 80 per cent coming from a Department for Transport grant to encourage cycling.

OpenStreetMap locally has worked with Birmingham City Council Transportation over the past year to understand how we could achieve a “realtime mapping” of the changes. They have provided a suitable opendata shapefile of all the roads affected and we have access to weekly project reports on works scheduled and completed, so we should be able to reflect the changes as they take place. Not quite “realtime” but a huge step towards it. It’s taken a deal of persistence on our part, but once we secured some internal sponsors, things moved forward consistently.

We’re still to decide how best to display all this but we have a map of the project’s scope and will also be using ITOWorld’s speed limit map.

Although the Traffic Regulation Order enacting the new legal speed limit doesn’t come into force until the project is completed, the signs will be visible. On the basis that we map what is visible we will be adding 20mph tags as work progresses. Whilst we’ll be reliant largely on progress reports from the Council, there are sure to be some sightings as we move around the affected areas.

2016 first quarterly project: schools

Happy New Year! (and Happy New Mapping Year!) The first Quarterly Project for 2016 is now under way and is Schools. There are really two strands to this project.

The first is to remotely (armchai)r map and get an increase in coverage of the number of schools

The latest government data is for January 2012 which shows 24,372 schools in England (including nursery schools, state-funded primary schools, state-funded secondary schools, special schools, pupil referral units and independent schools.)

For Wales that data is from January 2015 : 13 Nursery Schools; 1,330 primary schools;6 middle schools;207 secondary schools;and 37 special schools.

For Scotland data is from September2011 and shows 2,553 pre-schools, 2,081 primary schools, 367 secondary schools and 158 special schools.

For Northern Ireland data is from October 2015 and shows 96 nursery schools; 827 primary schools; 202 secondary schools and 39 special schools. Additionally there are 14 independent schools and 1 hospital school.

That gives a total of 32,318 schools. Taginfo shows 27,191 schools which is 84.1% coverage in OSM. However 6,348 are represented as nodes only. It would be great to have these as polygons and associated buildings. It would also be great to have close to 100% coverage.

This data comes from a cursory web search. If anyone has better or newer data, it’s welcome.

Schools can be remotely mapped (armchair mapping) by using Ordnance Survey OpenData StreetView(OSSV) data where school buildings are individually identified (but not always named). This data needs to be cross-checked with Bing aerial imagery which can often show OSSV schools as either having been demolished with a resultant brownfield site or housing redevelopment, or with buildings having been demolished and rebuilt in a new configuration. Often where a school site has ceased to exist, a completely new school site has been constructed nearby.

The second strand is for those who prefer surveying: existing school names change (e.g change to Academy Status, amalgamations); there will schools in OSM with no name, and with the advent of free schools, new ones will be appearing constantly.

So there’s plenty to do over the next few months!

There’s a progress table already established. You’ll need to access the sheet marked Schools.

Map of Hill Close Gardens

posted in: Map Improvements | 1

It wasn’t just Hadrian’s Wall that I mapped in OpenStreetMap as part of our third UK quarterly project – “all things tourism”.  Closer to home I visited and mapped the wonderful Hill Close Gardens in Warwick. The gardens are a “very rare example of detached Victorian leisure gardens which were found on the outskirts of many towns in Victorian times”. They comprise 16 individual plots, numerous summer houses and the larger visitor centre building. It was therefore no small task to add this to OpenStreetMap – in fact I still have a couple of plots left to map as I ran out of time on the day I visited the gardens!

Map of Hill Close Gardens, Warwick

In addition to my visit to the gardens (and the numerous photos I took), I made use of the Warwickshire County Council aerial imagery to help add in all the detail and paths. As a reminder to other OpenStreetMappers this aerial imagery is free to use to assist with your mapping efforts. It was fascinating to see how the area had changed over the years thanks to historical maps – this time from Warwickshire County Council’s mapping portal, although I’m sure there are some great maps on the National Library of Scotland’s site too.

Next steps are to finish off the last two plots in the north section of the garden. The gardens also provide lots of information about the history of each plot. It may be good to add this to the gardens’ entry on wikipedia. And of course, I need to add the wikipedia article details to OpenStreetMap so that we continue to build links between these two crowd-sourced projects.

View the map here.

Birmingham New Street Station

Surveying and editing the new  mainline multilevel station in Birmingham proved to be a mapping challenge; involving as it did keeping a lot of the existing edits, modifying most of them and then layering on the new developments. Very similar in mapping terms  to the physical work in actually renovating the stations whilst keeping it running.

The mapping is complete apart from a few pernickety errors, omissions and problems like the late completions of the taxi rank to the South of the station and the Metro Station to the North. The main improvement needed is  smoothing the curves of the platforms and  tracks. Getting them aligned to the lifts, escalators and stairs from the concourse above was bad enough!

One thing I haven’t been able to address is the  goods delivery access to the shopping mall above the station. Previously there was a service road on the roof  for delivery which was accessed via the ramp to the multistorey car park, but most of the roof is now a huge glassed dome. If anyone knows how it’s done please let me know.

The rendering limitations of OpenStreetMap meant some compromises were in order: mainly the prominence given to the pedestrian way for the Grand Central shopping mall as opposed to the pedestrian concourse underneath for the station concourse. Tagging the mall pedestrian ways as bridges was a possibility but that was really too much mapping for the renderer and not what’s on the ground.

To rectify this inability to render multiple layers, I thought I’d produce some floor plans of each level, selecting in JOSM layers various tagged levels. They’re only screenshots from JOSM as my  mapping skills don’t extend to taking the data and rendering as a map- and it would just take too long to learn. If anyone else wants to have a go then please feel free! I’ve produced two versions of each, one with a dark background and one with a light background. I have done some post-editing to make the concourse more prominent rather than relying solely on the footways in the original OSM data. The plans  may prove to be more useful separated like this than trying to interpret the complexity of the standard OSM map.

First New Street Station Concourse (at level 0)

New Street Station Concourse 4 New Street Station Concourse 3

Next the platforms underneath (at level -1)

New Street platforms 2New Street Platforms 1

Grand Central shopping mall (above the Concourse at Level 1)

Grand Central 2 Grand Central 1

And finally Level 2

New Street Sation Level 2 2 New Street Station Level 2

Some of these plans might make it to our mappa-mercia maps section, as a regional resource.

A few suggestions for improvements  in rendering complex public buildings like this:

  1. Display an icon and name for the entrances
  2. Display an icon for emergency exits
  3. Differentiate rendering for stairs and escalators
  4. Show direction of travel for escalators and stairs
  5. Display an icon for ticket barriers (turnstiles)
  6. Tagging schema for internal concourses and thoroughfares (maybe just add indoors=yes to highway=pedestrian and area=yes)
  7.  Opacity differentiation for multiple concourse/thoroughfare levels (even  just two would be useful)
  8. Specifically for railway stations – get the platform rendering to behave as if it understood OSM layers!

And apologies to anyone involved in indoor mapping – I found the documentation just too complex and confusing, but I’d like to learn. If anyone can review the data and demonstrate how to make a complete 3-D multilayer model I’d be very appreciative.

Mapping Hadrian’s Wall

posted in: Map Improvements | 0

Our third quarterly project for UK OpenStreetMappers saw us focus on all things tourism. A walking holiday along Hadrian’s Wall gave me a great opportunity to map one of the UK’s oldest, and definitely longest, tourist spots. Of course it was in no way a tourist site when it was first built in AD122, but just as maps have changed function from a military tool to an aid for tourists, so has Hadrian’s Wall.

IMG_20150905_160651525_HDR
A milecastle on Hadrian’s Wall

Along with other borders of the Roman Empire, Hadrian’s Wall is a World Heritage Site. Given this, and the prominence of site on the landscape, I was surprised to find that it wasn’t well mapped. The fortification comprises, from north to south, a ditch/cliff edge, the wall, the old military road, and finally another series of ditches know as the Vallum (to keep ordinary folk in the south out of the military zone). In places the Vallum had been mapped as the wall and big swaths of the wall were missing from OpenStreetMap.

Using my collection of photos, GPS traces, and the wonderful historical maps provided by the National Library of Scotland, it didn’t take long to improve the representation of the wall within OpenStreetMap. Now the wall (or wall-route where little of the original wall remains) is correctly mapped and gathered in a relation. The mapping of the vallum is also much improved.

The wall in OpenStreetMap. The gap in the left is Burgh Marsh - was the wall built here?
The wall in OpenStreetMap. The gap in the west is Burgh Marsh – was the wall built here?

There is however still plenty to do, including mapping other parts of the world heritage site such as the milecastles and the turrets that were built along the wall. A full record of what is included as part of the world heritage site is available on the UNESCO website, with mapped features added to an parent relation in OpenStreetMap.

Happy mapping!

Birmingham: A top 10 city by the number of POI

posted in: Map Improvements, Observations | 0

Have you ever wondered which cities have the most points of interest (POI) mapped in OpenStreetMap? That’s exactly the question that one user, baditaflorin, pondered over. With 65,093 features on the map, we are delighted that Birmingham ranks as number 9 in the count of most POI.

Head over to baditaflorin’s write-up to find out which city tops the list.

Image from DAKItrack.


Birmingham New Street Station re-opens

posted in: Map Improvements | 2

20 September saw the re-opening of Birmingham’s New Street Station after 5 years of redevelopment costing £750m. The  project involved the demolition of Stephenson Tower, a residential tower block; and the removal of 6,000 tonnes of concrete in order to increase the station’s capacity; whilst keeping the station undernaeath operational. A new shopping mall, Grand Central, was also constucted on top of the station, with John Lewis as the flagship tenant. Grand Central is due to open 24 September. A new metro line from Snow Hill station to New Street station is also underway and scheduled to open at the end of October.

New St 4

  • 170,000 passengers a day use Birmingham New Street, nearly triple the 60,000 a day it was designed for when it was last rebuilt in the 1960s
  • The new station can now handle 300,000 passengers per day
  • New Street is the busiest station outside London, with a train leaving every 37 seconds
  • 36 new escalators and 15 lifts, serving every platform, have been installed
  • About 60% of rainwater “harvested” from the new-look building’s facade will be used to flush the station’s toilets
  • About 1,000 workers were on site, 24 hours a day, seven days a week during the five-year revamp – increasing to 3,500 in its final months

Source: Network Rail

New St 2

Needless to say OpenStreetMap was there on opening day and our map is now updated to show the new layout as far as pedestrian entrances and approaches is concerned. But there’s lots more to do yet. And the contractors (as always) haven’t quite finished so some detail can’t be mapped yet.

New Street station has a complex layout which will challenge us in representing its multiple layers.

Starting from the bottom layer we have

1.railway lines and platforms

2.Station concourse

(multiple lifts,stairs and escalators joining 1 and 2 above)

3.Shopping mall

(multiple lifts,stairs and escalators joining 2 and 3 above)

4. Car Park

In addition there is a 10 storey office block on part of the building and the North and South entrances are at different levels.

New St Atrium 2

So we need to do some head scratching and planning to get it right: so PLEASE can  non-local mappers  offer your advice  and not just enthusiastically start adding multiple POIs and footways otherwise we’ll end up with an undecipherable jumble.

There’ll be a discussion thread up soon on talkgb where contributions can be planned. Help from public transport, railway and 3D mappers will be greatly appreciated.

New St Atrium3  New St Atrium 1

Highlights from Water Orton

posted in: Map Improvements, Mapping Party | 1

On Thursday 4th June the Mappa Mercia group met in Water Orton on the outskirts of Birmingham, UK, for our monthly mapping event. We had good weather but not everything else went to plan! Here’s a few highlights from our twitter account – you can follow us on @mappamercia.

Despite being briefly stopped by the police (a first for us) we had a great time mapping Water Orton. If you would like to join us next time we will be in Telford. Although details are yet to be 100% finalised it is looking like we will diverge from our normal ‘first Thursday of the month’ to make more of an event out of it. So join us on Saturday 4th July in Telford.

Strava routing errors: Useful or just another MapDust?

posted in: Map Improvements | 3

It is now becoming increasingly difficult to spot errors in OpenStreetMap just by looking at the map on openstreetmap.org. To help we have a collection of quality assurance tools, and this weekend I discovered a new one developed by Strava. The keen cyclists or runners amongst us will recognise the name – Strava is a phone app/service then enables you to monitor your athletic progress over time and compare it against others. To do this it keeps a track of your run/cycle using the GPS built in to your smartphone. Consequently Strava have built up a large database of GPS traces and user contributed map errors. From this they have built a “routing errors” website to help iron out any issues in the underlying map data, which naturally is based on OpenStreetMap.

Strava_routing_errors
Strava’s ‘routing errors’ service (link).

The service highlights 2 different types of errors: those manually entered by it’s users, and those automatically detected from the map data and the recorded GPS traces (e.g. many cyclists riding the “wrong” way down what is a one-way street in OpenStreetMap suggests that the OSM data may be incorrect).

I’ve had a quick play with this new quality assurance tool (with mixed results), but I’d love to hear your views. One concern is that the manually submitted “errors” may be a problem with user behaviour or the Strava app itself, rather than an issue with the OpenStreetMap data, al la MapDust – a similar, and now quite dated service from Skobbler. But is this view too pessimistic? Is there useful data in the manually submitted errors? And how about the (US only) automatically detected errors? Are these a reliable source of quality assurance data for OpenStreetMap?

Let us know your views in the comments section below and feel free to share any other great QA tips you may have.