OpenStreetMap recognised by Free Software Foundation Europe with Document Freedom Day Award 2014

On Saturday evening 22nd March at the Warehouse Café in Digbeth Birmingham members of mappa mercia received the annual Document Freedom Day Award 2014 on behalf of the OpenStreetMap Foundation from the Free Software Foundation Europe, whose members travelled down from Manchester for the event.

DFD certificate


Document Freedom Day is organised every year by the Free Software Foundation on the last Wednesday of March “ for celebrating and raising awareness of Open Standards and formats . On this day people who believe in fair access to communications technology teach, perform, and demonstrate.”  So watch out for events all round the world this Wednesday 26th March.

Last year’s award went to  Die Tageszeitung  for using  five Open Standards in publishing  their daily newspaper.

Receiving the award Brian Prangle long time OSM contributor and local mappa mercia community co-ordinator said: “It’s always great to have your work recognised, so thank you, on behalf of all the hundreds of thousands of contributors to OpenStreetMap, to FSFE for their award. We’re thrilled that you see OpenStreetMap as making such an effort towards open standards and it’s especially pleasing that you position us as an ‘emerging standard’”

DFD award


A celebration is nothing without a cake, so apart from the mandatory certificate which we can share with the whole of OSM, FSFE generously provided a superb cake which we ate so unfortunately we can’t share it! But rest assured we worked hard on behalf of OSM and devoured as much as we could before heading off to a nearby pub.

 DFD Cake

“This was a wonderful opportunity to learn about the achievements and problems faced by a sister movement” said Anna Morris from the Document Freedom Day campaign. “We found that we have many common goals and ample opportunity to share skills and resources.”

DFD cake cut

We had such a good time with a lovely bunch of people from FSFE and as Anna said we share many goals and ideals so we are planning to keep the contact and collaboration going to see how we can assist each other.

DFD group

Images   Andy Mabbett,
CC-by-SA 3.0

Coventry Bridge Munch

posted in: Map Improvements, Participate | 0

Sometimes in order to build something better you have to start by taking something old down. That’s exactly what happened in Coventry this weekend. And as always OpenStreetMap was the first to reflect these changes.

Coventry Friargate

The Friargate project is a major redevelopment project in Coventry, right next to the train station. The development encompasses 37 acres and will comprise a vibrant mix of commercial, civic, leisure, residential and hotel space. Currently the site, which will also be home to Coventry City Council’s new council office, is separated from the rest of the city centre by the ring road. Although some good work was done in time for the 2012 Olympics to help connect the Friargate site and train station to the city centre, there was certainly scope for a lot more. That something more, is a new “bridge deck” spanning the ring road:

“The bridge deck is a key part of the Friargate development at the railway station and the council’s own move to a new office building on the site. The bridge deck will better connect Friargate to the city centre by removing the raised roundabout and building a 100 metre wide connection across the ring road, creating a public boulevard linking the railway station through Greyfriars Green directly into Bull Yard.”

As the quote above mentions, stage 1 of the Friargate project was the removal of the existing (road traffic only) raised roundabout. The following image is from Coventry City Councils flickr account:

Junction 6 bridge removal

 Bridge munchers at work on Coventry’s ring road junction 6.

Why I contribute to OpenStreetMap

OpenStreetMap is a free, editable map of the world. It is often described as the wikipedia of maps, but its much more than just a map. All of the underlying map data is made available for anyone to use. You can create your own map style, create mountain bike routes, and many more things that are possible with geographic data. You’re only limited by what your own imagination hasn’t thought of yet!

This weekend, whilst the bridge munchers set about tearing the roundabout bridge down, I set about making the change in OpenStreetMap. Of course I had the easy job – it took only a couple of minutes and didn’t create any rubble or dust!

Using our relaunched mappa-mercia twitter I posted a quick tweet – one that was later retweeted by Coventry City Council:

CovRingRoad_Tweets

The above screenshot is taken from this Storify page created by the city council. It gives a great record of the events in the run up to, and during the bridge removal. I think it nicely sums up the benefit of OpenStreetMap!! Whilst Google Map’s change is still “pending”, the OpenStreetMap change is already live, both on our own maps, and those that use OpenStreetMap data (such as this FourSquare map).

Jump in to editing OpenStreetMap here and you can help too.

Not all Notes are equal

The Notes feature available on the OSM home page is a great way to encourage non-mappers to add comments and point our errors and omissions (it’s also a great method for mappers too!)

BUT …. now all the extant OpenStreetBugs Notes have migrated over , some of which are YEARS old, it’s all getting a bit crowded and hard to differentiate new notes.

I like to view new notes and try to encourage those who have added them to add more by either amending the map where it’s obvious what’s needed or I know the area; doing a ground survey if it’s close or adding a comment where the note is not clear. The encouragement only works if the note is acted on quickly.

So I have a proposal whereby notes are differentiated by age, gradually fading in colour as they age until they turn white , (much like us really!)

 So for example new notes get a bright colour on the day they’re created, then fade at week, month, 3 month, 6 month old until they become white after a year. I’m sure that to those who code such things this is not a major task

SotM 2013 pledges

posted in: Map Improvements, Participate | 0

One of the things we introduced at State of the Map 2013 in Birmingham was a “Pledge Wall”. The basic idea being that our delegates make a pledge to OpenStreetMap to be completed before the next State of the Map (now known to be in Buenos Aires in November 2014). It’s been six months since State of the Map 2013, so lets see how Mappa Mercia has delivered on its own pledges and those of other people.

  • Pledge: “To complete addresses for one UK postcode region” – A pledge made by our own Brian, and one that he completed in late November for the B11 postcode region. Well done Brian! I’ve also been adding a lot of postcodes to buildings already mapped in the CV3 area.
  • Pledge: “To organise at least one mapping party” – We held a belated Christmas meet-up in Warwick in January and managed to squeeze in some mapping before the light faded. Our next mapping party will be in Worcester on Saturday 15th March. Why not join us.
  • Pledge: “Train and encourage 1 person to be an active mapper” – This one’s always harder to do in Winter as the days are short and the weather (more) unpredictable. We’re looking to work with a local community near Stratford-on-Avon soon and will be providing OpenStreetMap training.
  • Pledge: “To evangelize about OpenStreetMap in central and local government” – For me I see this this as a slow burner. Public sector is generally considered to move slowly and when you add to this the recent cut backs, its not surprising that local government is focusing on delivering their day to day work (and rightly so). It’s not all bad news though. We now have access to Warwickshire County Council’s aerial imagery (a great source for mapping in OpenStreetMap) and Coventry Council are staring to use OpenStreetMap for more of their online maps.

So some good progress after just 6 months. Here’s to some more summer mapping fun!

On the Buses

posted in: Map Improvements | 0

Living in Coventry, it’s not often that I get to shout about some new mapping in my city. For most non-Coventrians, the simple fact is that Coventry is dwarfed by UK’s second city, Birmingham, situated just a stones throw away. In OpenStreetMap the situation is the same. There is however one area in which we winning – namely buses!

Route 360 Coventry
Route 360 as shown on Overpass Turbo

Earlier this month a new bus service was announced for Coventry, route 360. At 31.5 miles long it is now the longest route of any city in Europe. Better still the city that has now lost this accolade is… you guessed it, Birmingham!

So how long did it take to add such a long route to OSM? Well, thanks to the great work of Curran1980 this new route was fully mapped within the same week that it was announced in the local media, and a full 2 days before the route actually went into service.

You can view the route relation here and export the data using Overpass Turbo. For more details on Overpass Turbo, see my earlier blog post: Exploring OpenStreetMap data.

Half Way at New Street station Birmingham

posted in: Map Improvements | 0

On 28th April New Street Station got a brand new set of entrances leading to a brand new concourse.

This marks half way in the total transformation of the station.

The old entrances at the eastern end by T K Maxx are now closed and new entrances opened at the western end. If you’re approaching by car the new Drop and Go access is from the west,  off Navigation Street. There’s also a new short stay car park above the station approached from the Drop and Go access road. Anyone arriving at New Street station now has a totally transformed experience of modernity and light rather than the dingy dim experience of before. Congratulations to Network Rail!

Needless to say we had it surveyed and live to the world by lunchtime on April 28th, some 5 hours after the new configuration opened!

Birmingham completely covered with buildings

posted in: Map Improvements | 3

Today West Midlands mappers have  passed another major milestone: Birmingham has complete coverage for buildings!

Complete coverage does not mean we have EVERY building mapped, just that we’ve covered every area of the city. There will be the inevitable errors from buildings having been built and demolished and just from human error in missing a building. We welcome news from  the keen-eyed of any errors so we can improve the map even further.

It has taken two years of effort (often very tedious) tracing buildings from our own aerial imagery (supplied by Cities Revealed for the City Centre) and latterly from Bing. For new developments (new housing estates, industrial estates, supermarkets and demolitions) we have had to compare Bing with the latest release of OSSV which is newer and reveals a later state of building coverage. Nevertheless we reckon that we have the most accurate and complete coverage of any online map of Birmingham.

While we’ve been at it the other local authority areas in the West Midlands have also obtained pretty good building coverage. Estimates are:

Solihull
70%
Sandwell
30%
Coventry
20%
Dudley
10%
Wolverhampton
10%
Walsall
10%

Thanks are due to everyone who’s contributed – especially the 6 or so mappers who have contributed most of the work.

For those of you reading this outside the UK who might be thinking “ What’s the big deal?” every building has been traced by hand – we have no data import of building outlines available to us.

You can see a good visual analysis of coverage by using the excellent tools at ITOworld’s map service.

Of the 290,000 buildings added, 69,000 have full address information, complete with postcode.

The building count we estimate is under-represented by a factor of 8, as many are just represented by an outline rather than individual addressable units. For instance, a row of terraced houses of which Birmingham has hundreds, once surveyed and terraced with individual addresses can become up to 40 buildings, depending on the length of the terrace instead of one. This all depends of course on your definition of building; but we’re basing this on OSM tagging of building=residential (or similar in other circumstances) for each address.

There are over 400 tags applied to buildings; here are some of the more prevalent ones:

Tag
Qty
Listed Building
1,400
Residential
137,000
Retail
2,000
Garage/Garages
4,500
Yes
134,000
Industrial
1,000
House
5,000

Amongst the bewildering variety of tags we even have a chimney mapped! This is probably an old industrial artefact of some prominence. Anyone want to try finding it? (The person who mapped it is exempt from this challenge!)

All figures are for the West Midlands as a whole rather than just for Birmingham, and are rounded to the nearest thousand.

A exercise in micro-mapping: The National Memorial Arboretum

posted in: Map Improvements, Mapping Party | 1

The National Memorial Arboretum had been nagging at us for months, being a cultural resource of national significance situated within  our mapping “domain”, and having only the sketchiest of coverage in OSM (thanks to those who had got it to at least that level). So one evening in the pub we decided to tackle mapping its 150 acres (0.405 ha).

The National Memorial Arboretum sits on a piece of reclaimed gravel pit alongside the River Tame. Inaugurated in 1997, it was designed to rival the Arlington National Cemetery in Washington DC. Its obvious military bias is now being somewhat softened by the appearance of  memorials to any event – for instance there is a grove of trees where those reaching their diamond wedding anniversary (60 years) can plant a tree and have it dedicated to them.

Given the horrendously wet summer Britain has been experiencing, the three day survey carried out by mappa-mercia volunteers (all of two of us) spread out over a couple of weeks was a squelchy affair – a reclaimed gravel pit adjacent to a river has a pretty high water table!

There are over 200 memorials ranging from the simplest plaque; large gardens; benches; flagpoles; ornate sculptures on plinths; relics from battlefields and campaigns (for example pieces of the Burma Railway from WWII) to the elaborate centrepiece of the Armed Forces Memorial. And of course the 50,000 trees which are either arranged into named groves or are individually dedicated.

Here’s an example of a memorial – this one is for the Royal National Lifeboat Institution which has benches, a sculpture,pathways and a flagpole all contained within a garden designed to recreate the feel of a shingle beach:

We concentrated on the memorials, gardens and groves and we think we’ve got about 95% of them. The hundreds of benches and trees that have individual dedications overwhelmed us and will take someone more dedicated than us several months of surveying.  Of course memorials are being constructed constantly so periodic resurveys will be necessary. The day after our final survey a new memorial to the Parachute Regiment was due to be dedicated and there were feverish preparations underway for the ceremony.

In any case a resurvey will be required as the Visitor Centre is due to be expanded (reconstructed would be a better description judging by the plans on display) to cope with the visitor numbers- currently at 300,000 annually. Many visitors are grieving comrades or relatives, and there are of course the regular annual anniversary ceremonies by many veterans’ associations and military units; but as the site is such a fantastic educational resource for British history I guess it attracts many school visits also.

The problem with micro-surveying at this level was that the POIs to be recorded (memorials,benches,trees, flagpoles etc) were often closer together than the accuracy of our GPS units (sub 5 metre), so that interpreting GPS data could only take place with the help of a huge number of photographs to show proximity and orientation.  So the usual rule of thumb that one hour of surveying translates to one hour of editing  became more like 2- 3 hours of editing as GPS traces, notes and photos all had to be cross-referenced for accurate placement. Also most names of memorials were long and complex and needed careful attention to spelling.

The resulting map can be viewed here. As can be seen the current default rendering has problems with so many names being so close together that it’s difficult to display them all. Anybody want to have a go at solving this? Is it soluble?

There remains one other major mapping problem. The National Memorial Arboretum is part of the National Forest : an ambitious project to plant 200 square miles of central England with trees to recreate the original forested landscape. 7.8 million trees have already been planted and the tree cover increased from 6% to 18%.  How to map this? It’s not a national park. It’s not contiguous, but a patchwork. It’s not all forest but has open spaces also. Most of the tree-planting is not mature. It’s run by a private company created by Act of Parliament under the auspices of a government department DEFRA (Department for the Environment Food and Rural Affairs) – so is it leisure=park? Should its whole outline be mapped and named as a region with a ceremonial administrative boundary? Should the planted areas be mapped as a multipolygon and added to as new areas are acquired and planted? How should the constituent parts be named: as National Forest from the multipolygon, or for each area where it has a separate name? Any comments are welcome.

Next national resource in our region to tackle: the recently-opened National Football Centre at St George’s Park near Burton-on-Trent.

All Change for Birmingham City Centre Buses

posted in: Map Improvements, Participate | 3

A mapper’s job is never finished! For those of you who might think that the UK and Western Europe are pretty much complete and we don’t have much to do – there’s ALWAYS something changing somewhere.

Today, Sunday 22 July, is the culmination of several months of planning and roadworks to complete a major reconfiguration of Birmingham City Centre’s  bus stops which bans buses from the City Centre, grouping bus stops into 5 separate Interchanges on the periphery of the business/retail downtown area.

This has been done firstly to improve traffic flow on the bus network and secondly to free up streets for a Metro line extension from Snow Hill railway station to New Street railway station (so more changes for us later)

We’re proud to say that we have completed mapping and editing 80% of the changes today. ALL the physical changes have been surveyed, mapped and edited: what’s holding us back is untangling and re-routing the relations for bus routes. Another example of the combination of dedicated local mappers, OpenStreetMap and the editing tools at our disposal, being unbeatable!

The 2 organisations responsible, Network West Midlands and Centro, have published very good information and their staff have been very co-operative. Birmingham was blanketed with their staff today, helping out hapless passengers, who despite a week of blitz publicity, were still very confused. We made contact with the staff responsible for the data, swapping information about  our queries from ground surveys. We also got from them a rough timetable for the rollout of some additional, new bus stops. Hopefully we can build on this contact and keep up to date with future changes.

To get a feel for the surveying/mapping/editing effort:

  • 24 bus stops removed/deleted
  • 10 new bus stops added
  • 126 bus stops changed name
  • 5 new bus-only road links built
  • 1 dual carriageway reversed
  • 1 new car park access road added
  • 2 taxi ranks moved/removed
  • 3 streets reversed oneway direction
  • 3 streets pedestrianised
  • 89 bus route relations checked/revised

If you want the official version of the changes go to http://www.connectedcity.org.uk/

What lies beneath?

I know we have enough on our hands with mapping what we can see: but what about what’s under our feet (or wheels)?

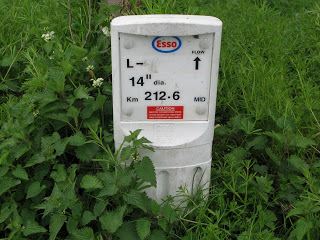
On my travels around the West Midlands countryside I regularly come across pipeline markers like the one illustrated. Depending on my route I can often join up the markers to trace the corresponding  underground pipeline. The oil pipelines carry a  lot of information as you can see which is why they get photographed.

They are a lot less common than the gas pipeline markers which are a boring white pipe about 2.5m high with a fluorescent orange top. These carry a lot less information just usually who you can ring in an emergency. Some have serial numbers but  by no means all. Where one can be seen in the distance but can’t be reached because there are no rights of way to it , the fluorescent marker allows a compass bearing to be taken and a distance estimated for later editing against Bing imagery.

Some pipeline markers have bright fluorescent roofs on them making them look like an arrow pointing skywards. They are numbered and are apparently designed for locating by aerial imagery, although I’ve yet to be able to discern one at Bing’s resolution.

The West Midlands has several oil pipelines crossing it, with at least 4 large oil terminals: BHX Airport; Kingsbury; Fort Dunlop; and Bedworth in our region so we get to see a lot of pipeline markers.

Linewatch runs an excellent website with information to help in preventing builders and civil engineers digging up and damaging pipelines. The page here has a great collection of pictures of what the different companies’ markers look like. In urban locations they can be  much more unobtrusive and consist of brass plaques mounted in the pavements. I’ve hunted for them around the Fort Dunlop terminal but without success so far. It might make a good treasure-hunt type of mapping party! My wife just thinks I’m nuts when I get excited about coming across one of these markers on our walks representing as it does, another piece of the jigsaw puzzle. She is good enough to point out ones that I’ve missed though!

There’s also a good schematic map of where the pipelines go. Very detailed locations, which are copyrighted, can be found  at a related membership site Linesearch, which is off-limits to us OSMers and is really for on-site contractors operating digging equipment.

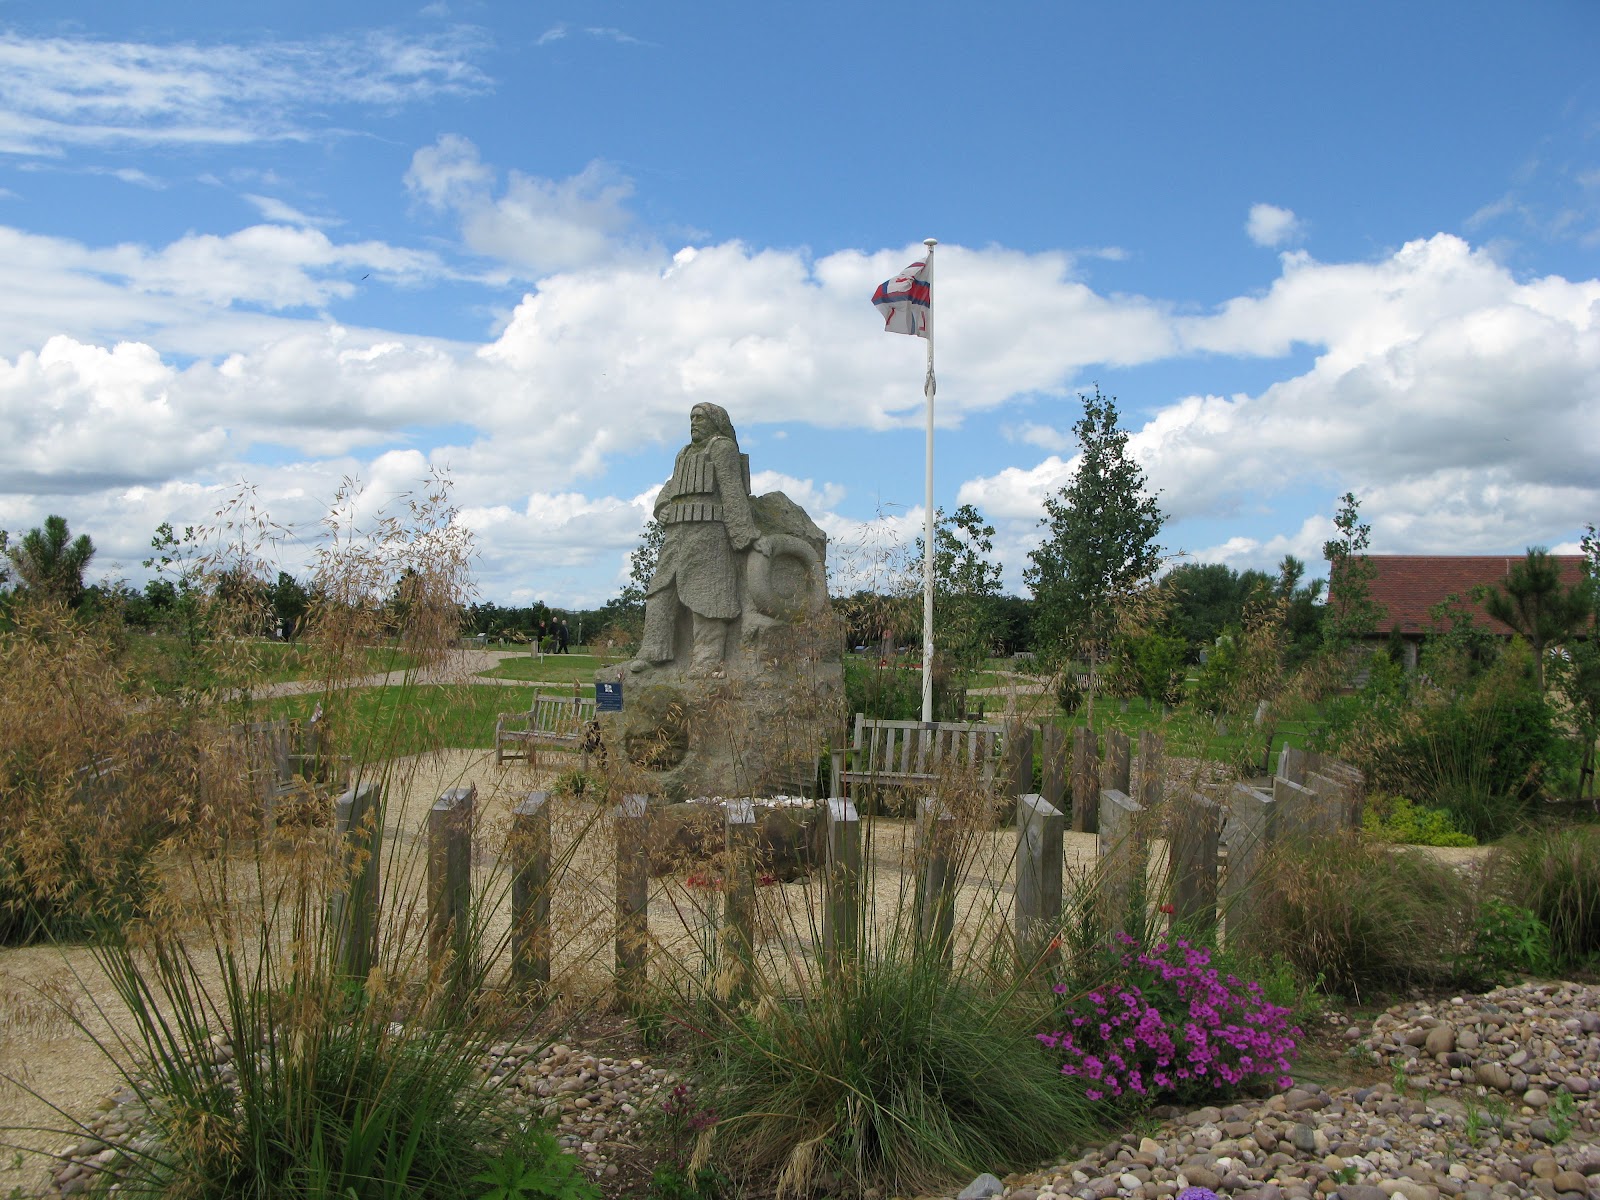
Birmingham is also the termination point of the Elan Valley Aqueduct, a (largely) buried pipeline bringing  water over 73 miles (118 km) from the Elan Valley reservoir in mid-Wales. Water travels at about 2 miles per hour along the pipeline taking about one and a half days to reach Birmingham at the Frankley reservoirs. It was built over 100 years ago, between 1893 and 1904 and is an engineering marvel, dropping only 52m over a length of 118 km – a gradient of 1:2300. The water arrives by gravity alone with no assistance needed from pumps. Whilst most of it is underground there are stretches of overground pipeline and there are  aqueducts bridged over rivers and the odd brick-built valve house. It was mapped with the aid of out-of-copyright Ordnance Survey maps.

Interestingly there is a large network of state-run pipelines known as GPSS (Government Pipeline and Storage System) largely for supplying military installations and is a hangover from World War II and Operation PLUTO (Pipeline Under the Ocean) prepared for supplying the D-Day landings.

As none of this gets rendered, why should anyone get excited about unseen, underground pipelines. Well, firstly there’s the intellectual satisfaction of working out what all the surface paraphernalia relates to and also of linking it altogether in a network. Secondly there’s a sense of completeness in mapping how energy, water and other industrial requirements traverse the planet. Thirdly if we’re given a tag which shows up in the editors (well it does in JOSM – I haven’t checked in Potlatch) then I suppose we’re duty-bound to use it!

Do other mappers in parts of the world, where land is not at such a premium as it is in the crowded islands of the UK and pipelines can  constructed above ground, map them? If they’re a major landmark shouldn’t they be rendered?

Perhaps the nice folks at ITOWorld will give us a rendered layer of pipelines?

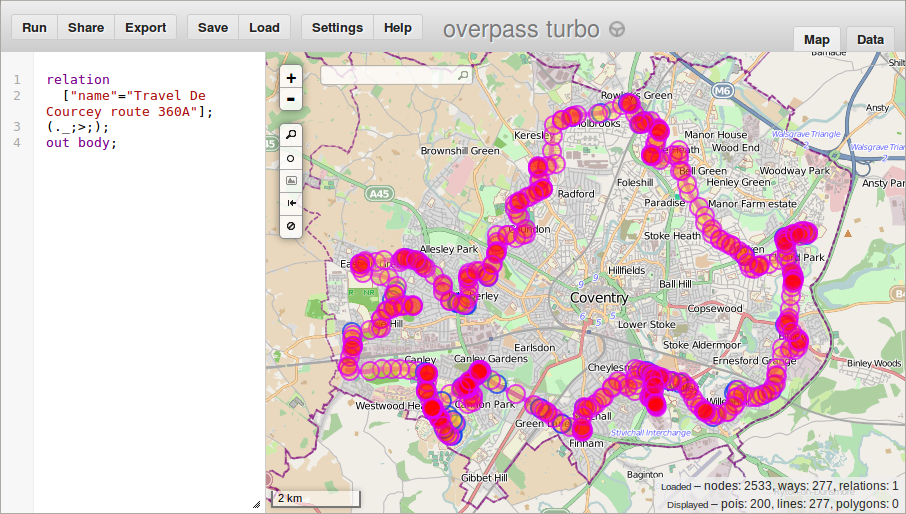
Is there a way of joining the surface links of a pipeline such as reservoirs, terminals, pumping stations, venting stations, refineries, chemical works together in a relation?

Currently I indicate direction of flow with a oneway=yes tag where this can be ascertained from the  above-ground marker, which results in an error message nag from the editor and lots of little arrows rendered that are attached to nothing. So if you see one of these arrows and are wondering what on earth it can be – I’ve been mapping pipelines beneath you.