Junction improvements: more than meets the eye

posted in: Map Improvements | 14

It’s been fascinating mapping the changes during 2019 for the major junction improvements under way at the Iron Lane junction in East Birmingham; long tolerated by users of the  A4040 Outer Ring Road for generating long waits especially for users of the adjacent Stechford Retail Park and long-suffering passengers on the 11A/11C outer circle bus route. “Pinchpoint” is the official nomenclature for such junctions.

The junction moves from being a signalised gyratory to a junction with two new roundabouts and improvements to north-south flow with a dualled section (involving a new bridge over the River Cole) and a  bypass northbound lane to avoid the new Ring Road roundabout. There also 5 new toucan crossing to be installed.

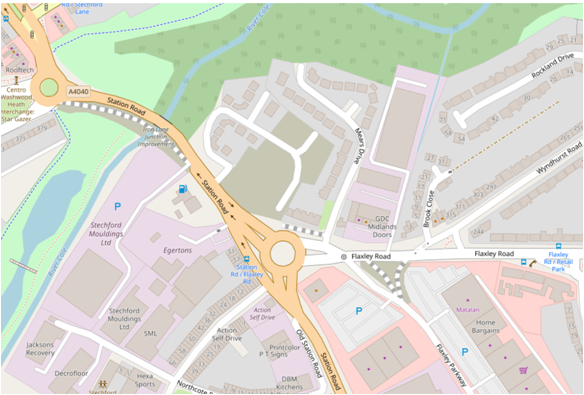
Iron Lane becomes restricted to a road with no addresses, joining the two roundabouts (the current mini-roundabout to the east is only temporary to ease traffic flow whilst the second roundabout is constructed).

Apart from the mapping complexity of keeping up with changes,  what makes this junction so interesting is that the majority of the funding comes from errant motorists caught and fined by Bus Lane enforcement cameras: £7.083m of the total cost of £12.984m. Next time I’m sat fuming on a delayed bus journey because of selfish prats who think BUS LANE doesn’t apply to them, I can feel smug that they’re funding road  improvements.

Iron Lane junction improvements  began in March 2019, and are expected to end in late 2020 with a major step forward on 9th December when a 350 tonne mobile crane made short work of lifting reinforced concrete box beams onto the newly constructed supports across the River Cole. The major roundabout on the A4040 is now open and work has started on the second roundabout for the new entrance to the Stechford Retail Park

But the story doesn’t start with the arrival of the diggers and road cones this year. Birmingham City Council first approved the scheme in March 2015 and preparatory demolition was completed in November 2016 ( I remember removing the Snooker Club from OpenStreetMap).  And the actual roadworks only cost £5.5m in the contract awarded to McPhillips. So why the delay and what cost so much more than the actual construction?

Putting aside the usual struggle to secure funding from an austerity-obsessed government, two main factors dominate:

Firstly the immense volume of documentation required for planning and other statutory requirements such as a 232 page traffic modelling report. To say nothing of the extensive consultation process required. Compulsory Purchase Orders even have to be justified by referral to provisions of the Human Rights Act. All those consultants and surveys take time and money.

Secondly, land acquisition by Compulsory Purchase Orders also eats time and money, especially when landowners’ lawyers get involved. The adjacent retail park is owned  by some tax-avoidance outfit in Luxembourg and the antics of their lawyers as documented by Birmingham City Council on their planning portal would make you howl with laughter if you’re cynically inclined or your blood boil if you have a bit more of a social conscience.

Needless to say only on OpenStreetMap can you see the latest road layout! Come back next year when it’s complete

Petrol stations with a fixme tag

posted in: Map Improvements, Participate | 3

As we described when we kicked off this quarters UK project to map petrol stations, recent community validation of third party (import) data has highlighted much outdated and erroneous data within OpenStreetMap :-(. For the Shell import we captured some of this and added it to a “fixme” tag. If you have not yet come across this tag then it is one in which OpenStreetMap users can flag something that looks wrong or requires additional information to improve the map.

It is possible to view petrol stations with a fixme tag by using Overpass Turbo scripts. We have done this already so all you have to do is click this link and press run. Results are visual as shown in the example below. There are approximately 130 petrol stations with a fixme tag so with some effort we should be able to review them all. Happy mapping!

Example result from Overpass Turbo.

Updating bus stops in the West Midlands

posted in: Map Improvements | 0

It has been 8 years since the original NaPTAN (National Public Transport Access Nodes) data was imported into the UK space of OpenStreetMap in 2009. It was done on a piecemeal basis and only in areas where it was requested, which was generally where there were active mappers. Since that time I am not aware of any organised attempts to bring that data up-to-date. There will certainly have been localised efforts based purely on surveys.


So when the local OSM community, mappa-mercia,  was approached by TfWM (Transport for West Midlands) with the offer of resources to bring the NaPTAN data up to date as TfWM was reviewing all their public map production and could consider OSM as a candidate for displaying this data, we leapt at the chance.
We had started out locally some 8 years ago with a lot of enthusiasm and surveyed bus stops crazily but given the scale of the task (some 12,000 bus stops) even a dedicated bunch of mappers is going to get bored – and so we did. Updates and confirmation of existing data languished outside of a couple of public transport enthusiasts and sporadic surveying by others when out surveying something else.
So two internal developers from TfWM and me set to work meeting every Tuesday afternoon in TfWM’s Birmingham head office to put matters right. Our aim was to get an accurate up-to-date map of Public Transport  data in the West Midlands using mostly NaPTAN data. We planned and documented and kept relevant OSM talk lists up to date with what we were doing.
Peripheral tasks were:
1. entering the location of all the new Swift Collector points – these are where passengers can upload new ride allowances into their Swift Smart Cards
2. entering West Midands Fare Zone data to all railway stations in the region
3. entering the proposed routes of all planned Metro tram lines
The first task was to clean up the existing OSM data. This involved moving bus stop nodes that were nodes on highways rather than to one side, identifying and tagging non-naptan bus stops  ( for example car park shuttle buses at the Airport, large campuses such as the National Exhibition Centre and personnel shuttle buses for multisite campuses, usually hospitals) and finally identifying, and resolving where possible,  what we dubbed “orphan” bus stops which were those surveyed by OSMers but with no NapTAN data attached.
The next task was to check the positional accuracy of the current 2017 NapTAN data against both aerial imagery and known OSM well-surveyed areas, as that would determine our approach. Sadly we found that the positional accuracy had not improved systematically over the 8 years. So any refresh of NapTAN data would have to rely on OSM position.
Our next step was to remove all those bus stops marked DEL, for deleted, in the NaPTAN data by removing the highway=bus_stop tag and adding a note to that effect and leaving the remainder of the tags. This was very much a belt-and-braces approach.
Next we updated all the bus stops that had a NapTAN identifier with a standardised naming convention preferred by TfWM and agreed by the local OSM community,  and with current route_ref information.
That left all the new bus stops that had been added in the intervening 8 years. This had to be done semi-manually in order not to remove any bus stops surveyed by OSMers and also to check the positional accuracy (OSM surveys always won!)
As CUS (Customary) stops do not render as there is nothing verifiable on the ground such as a pole we imported those first, as is.
Then any remaining “orphan” bus stops were checked against the new bus stops, relevant data transferred and positions moved before deleting them. We managed to remove nearly 300 of these but were unable to resolve about 50. Then the new bus stops with improved positions were imported. We could have automated this more, but preferred to adopt a more cautious , if laborious, approach of human review.
Finally, having achieved an accurate up-to-date bus stop estate we added shelter information: shelter=yes and shelter_ref=xxxxxxxx.
Loose ends are largely those bus stops still in existence on the ground with NOT IN USE displayed prominently on the pole flag, which NaPTAN treat as non-existent but OSMers can see and will map; and Ring and Ride bus stops which also were  not in the NapTAN data. There are also numbers of bus stops with poles that are still labelled as CUS in NapTAN.So we never achieved 100% accuracy but the percentage of errors/queries is of the order of <1%.
Next we have to agree with TfWM not to let our hard work atrophy by entropy  but keep the data up-to-date by agreeing a frequency of when we do it and a process of how we do it.
What we didn’t do: upgrade existing  and enter  missing bus routes as relations. Neither party was willing to devote the resources to entering these as relations. Which was a pity but maybe we have to realise that the easiest way of representing these given their quantity and volatility ( and the upcoming changes in the Bus Bill which will demand electronic submission of bus routes) is layering on the base map in a separate application.
The process in numbers

Item Approx number
Elapsed time 3 months
TfWM resource hours 30 hours
OSM resource hours 30 hours
Total  bus stops 12,500
Bus stops deleted 400
New bus stops imported 800
Orphans removed 300
Shelters added 5,000


Conclusion
TfWM have some great developers and we quickly developed a rapport together. We have built good relations not only at a personal level, but also as organisations.
If the state of our bus stop data in the West Midlands is typical for the UK then we have a lot of work to do to obtain an accurate UK-wide map of bus stops. If we were to  contemplate upgrading throughout the UK I would say it couldn’t be done without a dedicated full-time team and would consequently need some national sponsorship with a business case for devoting the resources necessary. A region-by-region or city-by-city approach would be more doable. So how about it OSM UK and DfT (Department for Transport)?

A guide to mapping Fire Hydrants in the UK


In the West Midlands our fire hydrant signs are generally placed on lamp posts:

The black H on a yellow background I believe to be a UK standard. The upper number is the diameter of the underlying water main in mm. The lower number is the distance in feet to the fire hydrant from the sign with the arrow showing the direction to the actual hydrant. There is also a reference number at the foot of the sign. So, having spotted the sign, the actual fire hydrant has to be found. The signs can get swivelled on the lamposts through maintenance interventions or general neglect and the arrows point in the wrong direction!

To complicate matters further, there are some fire hydrants that do not have a sign, and some older variants of the signs. These older signs tend to be attached to buildings or walls and I have no idea what the numbers refer to.

So you have to on the lookout on the ground as well as spotting yellow H  signs.Fire hydrant covers generally have FH on them to identify them, although some older ones can have just H only. Whether the older style ones are still operational I don’t know, but they get mapped anyway.


And of course it’s always good to see public organisations collaborating successfully with each other!

The basic tag is emergency=fire_hydrant with more details on the OSM wiki

Why the sudden interest in fire hydrants? In the UK, they’ve languished as an item that gets mapped.

At our last mappamercia pub meeting Andy Mabbett regaled us with his saga of trying to get West Midlands Fire Service to release the locations of fire hydrants under Freedom of Information legislation.

The full saga can be found here

WMFS refused to release the information on the grounds of national security viz: “publishing information about water  networks and other parts of the critical national infrastructure could  expose vulnerabilities in the network and pose a serious risk to public health either through non availability of water resource or
contamination of supplies. There does not have to be any evidence that this is being planned but it is a possibility given the current threat level in the United Kingdom.”

An appeal by Andy against WMFS to the first-tier information rights tribunal mainly on the grounds that other Fire Services in the UK had already released their information on fire hydrants was rejected. The judges agreed with the Information Commissioner’s Office (ICO) assessment:

“The ICO concluded that the withholding of the information was reasonably necessary for national security and a listing of hydrants and their locations would assist in the planning of an attack by poisoning on water supply infrastructure by identifying access points. Such an attack on the infrastructure would be in the domain of national security. While hydrants are visible a comprehensive list of the precise location of every hydrant would place in the public domain more information than is available through hydrants being visible. WMFS supplied a list of attacks and attempted attacks on water supplies.The ICO considered that such an attack was plausible.”

There is a method for contaminating the water supply known as backflow contamination, which is considered to be reasonably easy according to an excellent paper here which quotes extensively from US military and homeland security sources. Fire hydrants are one possible source to generate backflow.

My limited understanding of water networks is that backflow is a general problem for the water supply industry, which can mitigate the effects with backflow prevention devices. Just how extensive and successful this mitigation is in the UK (and thus how safe we are from backflow attacks) will remain a commercial mystery, as our water supply is in the hands of private companies who are under no obligation to reveal such information. ( I have another story about water networks and open information which will be the subject of a later blog)

Given the cult of secrecy that exists at all levels of official Britain, it also seems unlikely there will be any disclosure of the risk levels of such an attack vector so that we might make up our own minds based on the data. We will have to make do with the assurances of “those that know best”. The public’s role seems to be limited primarily to that of potential or actual victims.

This issue does raise some interesting ethical challenges for OpenStreetMap as it seems to be sending us back several centuries when accurate maps were regarded as military secrets. Or to the days of the Cold War when our national mapping agency the Ordnance Survey would obligingly leave blank spaces on their maps at the sites of military installations. Would a map of fire hydrants in the West Midlands be construed as offence under ss57&58 of the Terrorism Act 2000: collecting, possessing or making a record of information of a kind likely to be useful to a person committing or preparing an act of terrorism? Should we be standing up for opendata, one of the founding principles of OpenStreetMap, or protecting  (supposedly) national security? What is the position in other jurisdictions where there are more draconian restrictions about identifying and mapping military installations and “national critical infrastructure”? Are mappers more circumspect there?  What’s the legal postion- is the OSMF liable for prosecution or just the contributing mapper or both? Should OSMF comply with a demand to remove information on the grounds of national security? Or to refrain from collecting it in the first instance?

According to taginfo there are only 1786 fire hydrants mapped in the UK, of which there are now about 300  in the West Midlands. Prior to my interest being piqued by this sorry tale there were only about 5 fire hydrants mapped in the West Midlands. Judging by the density of fire hydrants I’ve discovered so far, there are probably thousands in the West Midlands so I seriously doubt whether we’ll ever crowdsource the location of all of them,(or even many more than we have already).

Nonetheless, it’s been an education in another aspect of urban infrastructure I wasn’t really aware of, and a confirmation of the patrician “you don’t need to know about that” attitude of much of British officialdom.

(all of the images are my own and are published here as public domain)

.

Summary of the Summer UK Quarterly Project

Our Summer project  which ended on 30 September was to map as many farmyards as we could.
1. We added 1499 farmyards, which compares to an increase of 853 schools for the schools project which seems to suggest farmyards was a more active project, but the schools project added 3653 polygons( i.e we converted lots of nodes to polygons, thereby enriching the data). So this time we created more data, rather than improve existing data.
2. We gathered momentum during the project: it took 39 days to edit the first 500 farmyards; 33 for the next 500; and 20 days for the ultimate 500 (well, 499)

3. There are over 19,000 place=farm tags, almost all of them (>18,000) nodes. Mostly they seem to indicate farms but sometimes they get used too enthusiastically for any group of buildings. It is generally agreed that this tag really doesn’t add any useful information and its use should be discouraged.

4. We have 36 generically named Poultry Farm or Poultry Houses copied from OS OpenData, which describes the farm but doesn’t actually name it!

5. A lot of farms in Herefordshire (which is where I mapped mostly for this project) don’t have the word Farm in their name. Is this the case elsewhere?

6. If Herefordshire is anything to go by road alignment in rural areas can be pretty poor.

7. Waterways traced from NPE are severely misaligned.

8. 5 and 6 might suggest themselves as future quarterly projects. Correcting them around farms I added certainly slowed down my output.

9. Don’t ask farmers to help you mapping during their busiest time of year! I got zero response from my approaches.

10. Most unusual name I found was Cold Comfort Farm. There are 4 of them in the UK and had a comic novel named after them

Herefordshire farmyards before and after:

hereford-farms-june hereford-end-sep

UK Summer Quarterly Project

Today saw us pass the 1,000 total for farmyards added during this project(1008 to be precise).

Well done to everyone who has participated. What has been the most unusual farm name anyone has come across?

stone_built_slurry_tank_at_moel_y_mab-_part_of_the_leighton_model_farm

Picture Wikimedia Commons: Rod Trevaskus       cc0

Only a couple of weeks left – time to start thinking about our next quarterly project, while we see how many more farmyards we can add.

A surprising rural waymarked walk in the heart of a city

Dudley, in the heart of the Black Country in the West Midands, is not the sort of place you’d envisage a rural walk. The Black Country is so-named for its iron and coal and industrial might. Some  have claimed the furnaces and mines of the Black Country were the basis for JRR Tolkien’s Mordor in Lord of the Rings. Most of the industry has now disappeared and left lots of brownfield sites, crumbling industrial buildings and a struggling economy, with its associated social problems.

I have recently walked, surveyed and mapped the Limestone Walk. And  what a delight it was!  It was easy to forget the adjacent presence of a dense urban environment. The walk is poorly publicised and poorly mapped (the waymarking can be poor in places also). I could find little on the web which could act as a practical guide for anyone wanting to walk this route. The best I found was from the excellent Discovering Britain resource provided by the Royal Geographical Society.

So I thought – here’s an opportunity to demonstrate the capabilities of OpenStreetMap. This is the result of my efforts, taken from Lonvia’s Waymarked Trails

Limestone Walk

The walk commences at the ruins of Dudley’s mediaeval Priory and ascends Castle Hill (unfortunately Dudley Castle and its zoo are a paying attraction so the walk has to avoid them). Castle Hill is riddled with collapsed limestone mines and also with canal tunnels. A small diversion to the Black Country Living Museum is well worth the effort: it provides an extensive depiction of the industrial and social history of the Black Country.

But the jewel in the crown of the walk has to be its passage through the Wren’s Nest National Nature Reserve. It has been a national nature reserve since 1956 and there is currently a bid to place it in  wider regional GeoPark. It is world famous geologically for its well-preserved Silurian coral reef fossils and is one of the most diverse and abundant fossil site in the British Isles.  It is also famous historically for here it was  that the Scottish palaeontologist Sir Roderick Murchison studied the fossils and rock formations that led to him defining the Silurian System. 

The crater Murchison on the Moon and at least fifteen geographical locations on Earth are named after him. These include: Mount Murchison in the Mountaineer Range, Antarctica; Mount Murchison, just west of Squamish, British Columbia, Canada; tiny Murchison Island in the Queen Charlotte Islands in the same province; Murchison Falls (Uganda); and the Murchison River in Western Australia. The town of Murchison in the Tasman Region of New Zealand’s South Island was also named after him. It would be interesting to discover how many of these are mapped in OpenStreetMap.

The walk culminates on Sedgley Hill.  At 277m, reputedly the next highest point East is in the Ural Mountains. There are stunning views over much of the West Midlands, Staffordshire and Worcestershire; Birmingham’s city centre with its cluster of tall buildings can be seen in the distance squatting as it does on a low ridge.

Dudly Council, under severe financial pressure, is doing it best to improve the infrastructure of the walk and to promote its use.I hope OpenStreetMap’s resource can be of use to them.


Visualising Food Hygiene Rating Scheme (FHRS) and OSM data

Greg Swinford has  developed some tools for visualising Food Hygiene Rating Scheme (FHRS) and OSM data, finding possible matches between it and importing useful tags into JOSM.

FHRS data is a useful source of postcodes and addresses, and it can also be a helpful reminder of local establishments to add to the map. The tools will  help us to efficiently add and verify data in our local areas (rather than importing large amounts of data automatically).

FHRS is a central government scheme run by the The Food Standards Agency: the inspections are carried out by local authorities.The food hygiene rating or inspection result given to a business reflects the standards of food hygiene found on the date of inspection or visit by the local authority. The food hygiene rating is not a guide to food quality.

Greg has  created a set of maps (one per OS Boundary Line district) for the West Midlands and uploaded them here: https://dl.dropboxusercontent.com/u/42978572/FHRS%20West%20Midlands/index.html <https://dl.dropboxusercontent.com/u/42978572/FHRS%20West%20Midlands/index.html>.

Greg doesn’t have the time or computing resources to update the data very regularly or to widen the geographical area beyond the West Midlands, but the code is freely available at http://github.com/gregrs-uk/python-fhrs-osm <http://github.com/gregrs-uk/python-fhrs-osm> if anyone would like to use it.

The tools are a fantastic resource, enabling you to find estbalishments that haven’t been mapped and also for adding addresses and postcodes for thos that have already been mapped

FHRS 1 When you click on a POI you get the FHRS data:

FHRS 2

Becoming mobile: MAPS.ME and Geopedia

posted in: Map Improvements, Participate | 0

Back in June of last year we shared with you Richard Fairhurst’s State of the Map US talk in which he set out the case for more mobile OpenStreetMap apps. One of the key message was that “we need to think about smartphone editors” as a way to continue growing OpenStreetMap. This month we got a new mobile editor and a new app to help you explore your surroundings.

Firstly the new editor. This comes in the form of an update to the popular MAPS.ME. Even before this update MAPS.ME was a essential app for any OpenStreetMapper. It provides a simple to use offline map with voice over guidance for travel directions by car or on foot. It’s interface is simple and effective: for example, clicking on a map feature brings up a slider at the bottom of the screen providing more information.

On April 5th 2016, MAPS.ME developer Ilya Zverev explained how you can now edit the map information direct from the app. This is perfect for adding addresses, phone numbers and opening hours to existing map features whilst out and about.

Editing OpenStreetMap with Maps.Me
Editing OpenStreetMap with MAPS.ME

With more than 7 million monthly active users MAPS.ME is aiming to be the number one OpenStreetMap editor. Although OpenStreetMap’s editor usage stats are a little out of date, it’s already clear that MAPS.ME is the most used mobile editor measured by number of users.

The second addition to mobile comes in the form of Geopedia. This is a neat little app that takes the OpenStreetMap base map and overlays the wikipedia database. Clicking on the map shows you all the nearby features that have a wikipedia article (we understand this is based on wikipedia’s latitude/longitude data rather than the wikipedia tag stored within OpenStreetMap).

Searching for nearby attractions with geopedia.

As this links to wikipedia you can view the articles in multiple languages and view an image if one is available. It works well to find new and exciting places to explore in your neighbourhood, or whilst away travelling. And of course you can use it as a prompt to add text and photos to wikipedia, and map details to OpenStreetMap – perhaps via MAPS.ME!

Mapped: Every school in the Outer Hebrides and Shetland Islands!

posted in: Map Improvements, Participate | 1

Progress on our fifth OpenStreetMap quarterly project – schools continues to delight. Today we congratulate the HS (Outer Hebrides) and ZE (Shetland Islands) postcodes for becoming the first to reach 100% completeness!

Not even a month in to the latest UK Quarterly Projects and there has already been so much to celebrate. Here are the highlights from the third update on our project to map Schools.

1. HS and ZE are 100% complete!
Yes you read it right! Mapping of schools in the HS (Outer Hebrides) and ZE (Shetland Islands) postcodes are complete thanks to the efforts of OpenStreetMapper seumas. This means that all schools are mapped as a land area at minimum. We continue to add detail (e.g. buildings, sports pitches and paths) to further improve the mapping of the schools. Many other postcodes (most with more schools within them 😉 ) are close to 100% complete now too. Follow the progress here.

Sir E Scott School in in the Outer Hebrides. Image courtesy of Urban Realm.
Sir E Scott School on Tarbert in the Outer Hebrides. Image courtesy of Urban Realm.

2. Open Data Manchester
Following a tweet Open Data Manchester have asked whether anyone can go and show them how to map. Looks like their next meeting is Monday February 1st, 6.30 – 8.30pm. Any volunteers?

3. 175 people have done 5351 edits
Amazing numbers measured by Harry’s tracker. Looks like Uganda has joined the project too. It would be great if  someone could turn the CSV linked data at the bottom of the tracker into a daily chart. Drop us a comment below if you are able to help.

4. Nodes converted to ways
Following lot’s of data clean up we are nearing 80% of schools mapped as land areas rather than simple points. We should hit this in the next couple of days.

5. Northern Ireland still needs some work
If you map in Northern Ireland and want to get involved please do. Each extra school mapped there will help lift it off the bottom of the tracker. We can also look at doing some initiatives in NI if the local community want this. Let us know 🙂

Interested in mapping schools in your area? To join us see here. Never mapped before? No worries, contact us for a helping hand.