Mapping an Industrial Dispute

posted in: Use The Map | 0

Birmingham is in the grip of an industrial dispute by binmen which is causing rubbish to pile up on the streets due to missed refuse collections. Needless to say this is causing much consternation amongst the citizens and businesses of the city and the local media and politicians. The causes of the dispute are long-running  and its resolution looks to be long-running also.

We do however have a map of the effect of the dispute, based on a release of data by the City Council of where residents have complained about missed refuse collections. The map was developed in Carto, and hence based on OSM data, by Matt Cannon who is digital development editor at the Birmingham Mail, one of our regional newspapers.

Are there any other examples of industrial dispute mapping?

Transport for West Midlands: Public Art

posted in: Use The Map | 0

Scattered around the West Midlands at bus interchanges are numerous sculptures, commissioned by the transport authority, Centro. They were commisioned and erected in the early optimistic years of the current century. They are quite striking and try to reflect the history and local culture of the community which use the bus interchanges.  Bus interchange sounds a grand title, but on the ground they’re mostly collections of bus stops, where you need to change bus routes.

Not every bus interchange has a sculpture and I don’t know what the criteria were for choosing them. I guess the money ran out before completion.

Centro no longer exists, having changed its name to Transport for West Midlands, upon the creation of the new tier of local government, the West Midlands Combined Authority.

I decided to make a separate map of these artworks, even though they can be found in the West Midlands Heritage map, where they are just another artwork amongst hundreds of others. They are a unique collection of public artwork and are regularly photographed for wikimedia,flikr and the like. So if you see these photos and wonder where the artworks are, there’s no map to find them. So a dedicated map seemed the best solution.

tfwm-artwork

I use umap to create the map and found it incredibly easy, and  I will certainy be creating more maps with umap. It took at least ten times longer to ensure the data was correct.

Birmingham roundabout amongst the most dangerous in the country

posted in: Use The Map | 0

Yesterday the Birmingham Post (our weekly city newspaper) carried a story about the number of accidents on major Birmingham roundabouts. The recently reconfigured roundabout at Bordesley Circus, with an accident every 20 days over the previous six years is the second most dangerous roundabout in the country. That’s a total of 105 accidents.

The Post chose to illustrate its story with graphics based on OpenStreetMap data; showing the site of accidents. Without attribution it has to be said: we’ve already contacted the editor pointing out our attribution policy

The story went on to list the next five most dangerous roundabouts in the city, each with its OSM-based diagram of accidents.

Its always good to see our data being used. Even better to see it being attributed!

Busy days

posted in: Participate, Use The Map | 1

Yesterday I attended the Landor Future Highways Conference at the new iCentrum building on Birmingham Science Park, at the invitation of the Birmingham ODI (Open Data Institute) node. It was good to see so many OSM maps being used by presenters (thankyou Devon County Council and TransportAPI). I  was provided an adhoc slot into the programme to deliver a lightning 5 minute presentation about OpenStreetMap (thankyou Birmingham ODI node). It was a bit daunting presenting to highway professionals, especially in front of a screen the size of an IMAX cinema!

Then it was off to Leicester to train new volunteers in editing with iD, as part of Leicester City Council’s walking-mapping project which is an  extension of their weekly Leicester health Walks. Thanks to Sara for organising the training and to Chris, Alan, Stan and AJ who took their first steps editing OpenStreetMap. We all look forward to you increasing the data coverage in Leicester.

I’ve just about finished the edits from our June mini-mapping party in Kidderminster  from 2 weeks ago, when guess what?  Our July mini-mapping party is tonight in Tamworth – everyone welcome. We’ll be meeting in the Globe Inn Lower Gungate, Tamworth B79 7AT at 8pm.


A surprising rural waymarked walk in the heart of a city

Dudley, in the heart of the Black Country in the West Midands, is not the sort of place you’d envisage a rural walk. The Black Country is so-named for its iron and coal and industrial might. Some  have claimed the furnaces and mines of the Black Country were the basis for JRR Tolkien’s Mordor in Lord of the Rings. Most of the industry has now disappeared and left lots of brownfield sites, crumbling industrial buildings and a struggling economy, with its associated social problems.

I have recently walked, surveyed and mapped the Limestone Walk. And  what a delight it was!  It was easy to forget the adjacent presence of a dense urban environment. The walk is poorly publicised and poorly mapped (the waymarking can be poor in places also). I could find little on the web which could act as a practical guide for anyone wanting to walk this route. The best I found was from the excellent Discovering Britain resource provided by the Royal Geographical Society.

So I thought – here’s an opportunity to demonstrate the capabilities of OpenStreetMap. This is the result of my efforts, taken from Lonvia’s Waymarked Trails

Limestone Walk

The walk commences at the ruins of Dudley’s mediaeval Priory and ascends Castle Hill (unfortunately Dudley Castle and its zoo are a paying attraction so the walk has to avoid them). Castle Hill is riddled with collapsed limestone mines and also with canal tunnels. A small diversion to the Black Country Living Museum is well worth the effort: it provides an extensive depiction of the industrial and social history of the Black Country.

But the jewel in the crown of the walk has to be its passage through the Wren’s Nest National Nature Reserve. It has been a national nature reserve since 1956 and there is currently a bid to place it in  wider regional GeoPark. It is world famous geologically for its well-preserved Silurian coral reef fossils and is one of the most diverse and abundant fossil site in the British Isles.  It is also famous historically for here it was  that the Scottish palaeontologist Sir Roderick Murchison studied the fossils and rock formations that led to him defining the Silurian System. 

The crater Murchison on the Moon and at least fifteen geographical locations on Earth are named after him. These include: Mount Murchison in the Mountaineer Range, Antarctica; Mount Murchison, just west of Squamish, British Columbia, Canada; tiny Murchison Island in the Queen Charlotte Islands in the same province; Murchison Falls (Uganda); and the Murchison River in Western Australia. The town of Murchison in the Tasman Region of New Zealand’s South Island was also named after him. It would be interesting to discover how many of these are mapped in OpenStreetMap.

The walk culminates on Sedgley Hill.  At 277m, reputedly the next highest point East is in the Ural Mountains. There are stunning views over much of the West Midlands, Staffordshire and Worcestershire; Birmingham’s city centre with its cluster of tall buildings can be seen in the distance squatting as it does on a low ridge.

Dudly Council, under severe financial pressure, is doing it best to improve the infrastructure of the walk and to promote its use.I hope OpenStreetMap’s resource can be of use to them.


Visualising Food Hygiene Rating Scheme (FHRS) and OSM data

Greg Swinford has  developed some tools for visualising Food Hygiene Rating Scheme (FHRS) and OSM data, finding possible matches between it and importing useful tags into JOSM.

FHRS data is a useful source of postcodes and addresses, and it can also be a helpful reminder of local establishments to add to the map. The tools will  help us to efficiently add and verify data in our local areas (rather than importing large amounts of data automatically).

FHRS is a central government scheme run by the The Food Standards Agency: the inspections are carried out by local authorities.The food hygiene rating or inspection result given to a business reflects the standards of food hygiene found on the date of inspection or visit by the local authority. The food hygiene rating is not a guide to food quality.

Greg has  created a set of maps (one per OS Boundary Line district) for the West Midlands and uploaded them here: https://dl.dropboxusercontent.com/u/42978572/FHRS%20West%20Midlands/index.html <https://dl.dropboxusercontent.com/u/42978572/FHRS%20West%20Midlands/index.html>.

Greg doesn’t have the time or computing resources to update the data very regularly or to widen the geographical area beyond the West Midlands, but the code is freely available at http://github.com/gregrs-uk/python-fhrs-osm <http://github.com/gregrs-uk/python-fhrs-osm> if anyone would like to use it.

The tools are a fantastic resource, enabling you to find estbalishments that haven’t been mapped and also for adding addresses and postcodes for thos that have already been mapped

FHRS 1 When you click on a POI you get the FHRS data:

FHRS 2

Birmingham New Street Station

Surveying and editing the new  mainline multilevel station in Birmingham proved to be a mapping challenge; involving as it did keeping a lot of the existing edits, modifying most of them and then layering on the new developments. Very similar in mapping terms  to the physical work in actually renovating the stations whilst keeping it running.

The mapping is complete apart from a few pernickety errors, omissions and problems like the late completions of the taxi rank to the South of the station and the Metro Station to the North. The main improvement needed is  smoothing the curves of the platforms and  tracks. Getting them aligned to the lifts, escalators and stairs from the concourse above was bad enough!

One thing I haven’t been able to address is the  goods delivery access to the shopping mall above the station. Previously there was a service road on the roof  for delivery which was accessed via the ramp to the multistorey car park, but most of the roof is now a huge glassed dome. If anyone knows how it’s done please let me know.

The rendering limitations of OpenStreetMap meant some compromises were in order: mainly the prominence given to the pedestrian way for the Grand Central shopping mall as opposed to the pedestrian concourse underneath for the station concourse. Tagging the mall pedestrian ways as bridges was a possibility but that was really too much mapping for the renderer and not what’s on the ground.

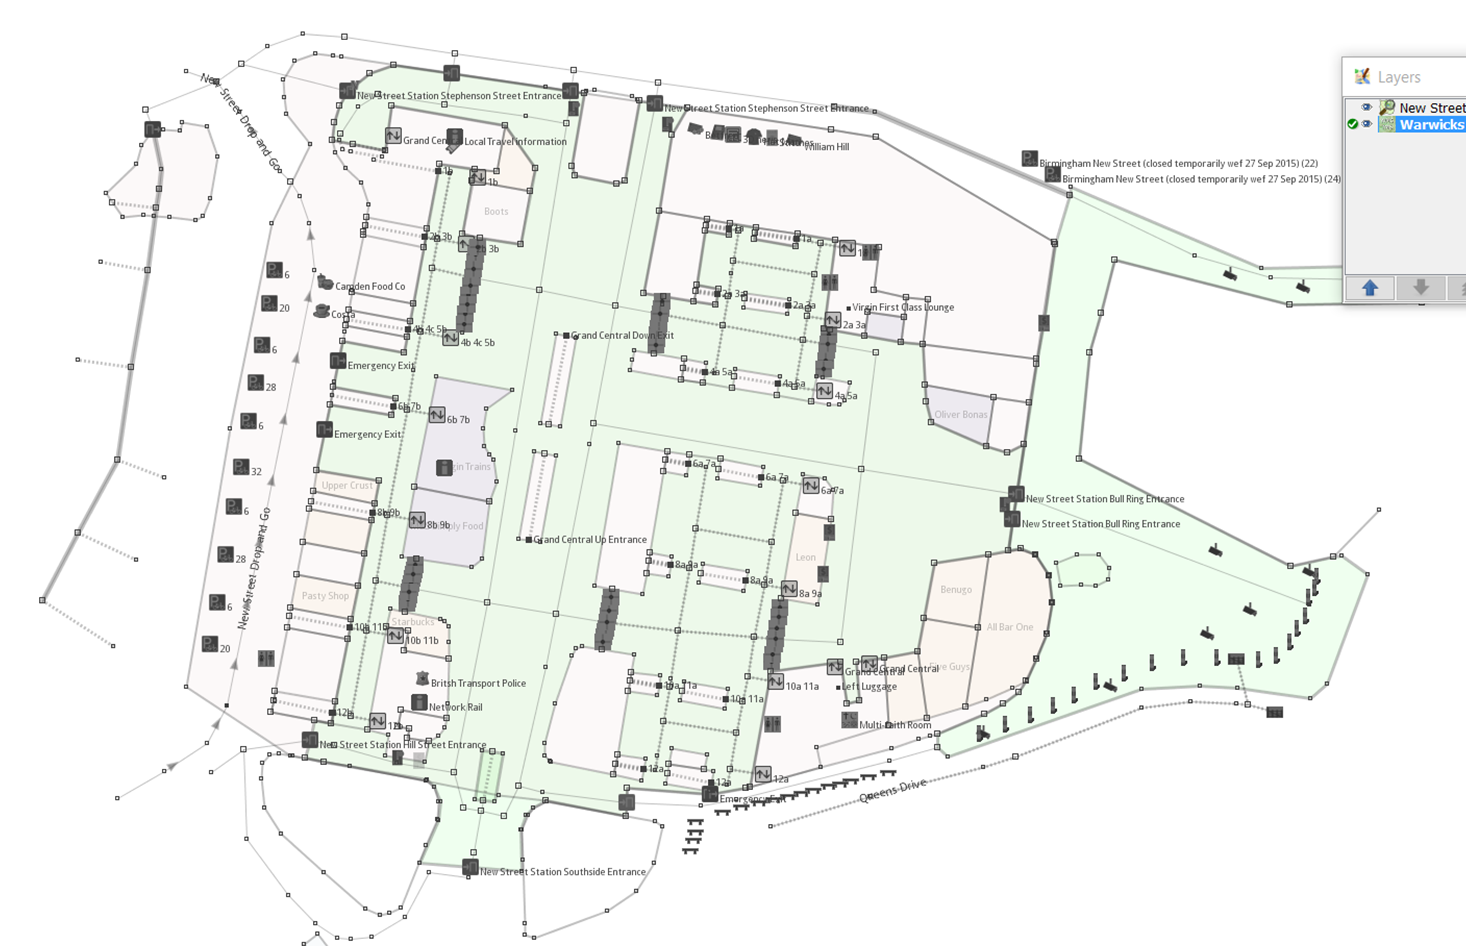
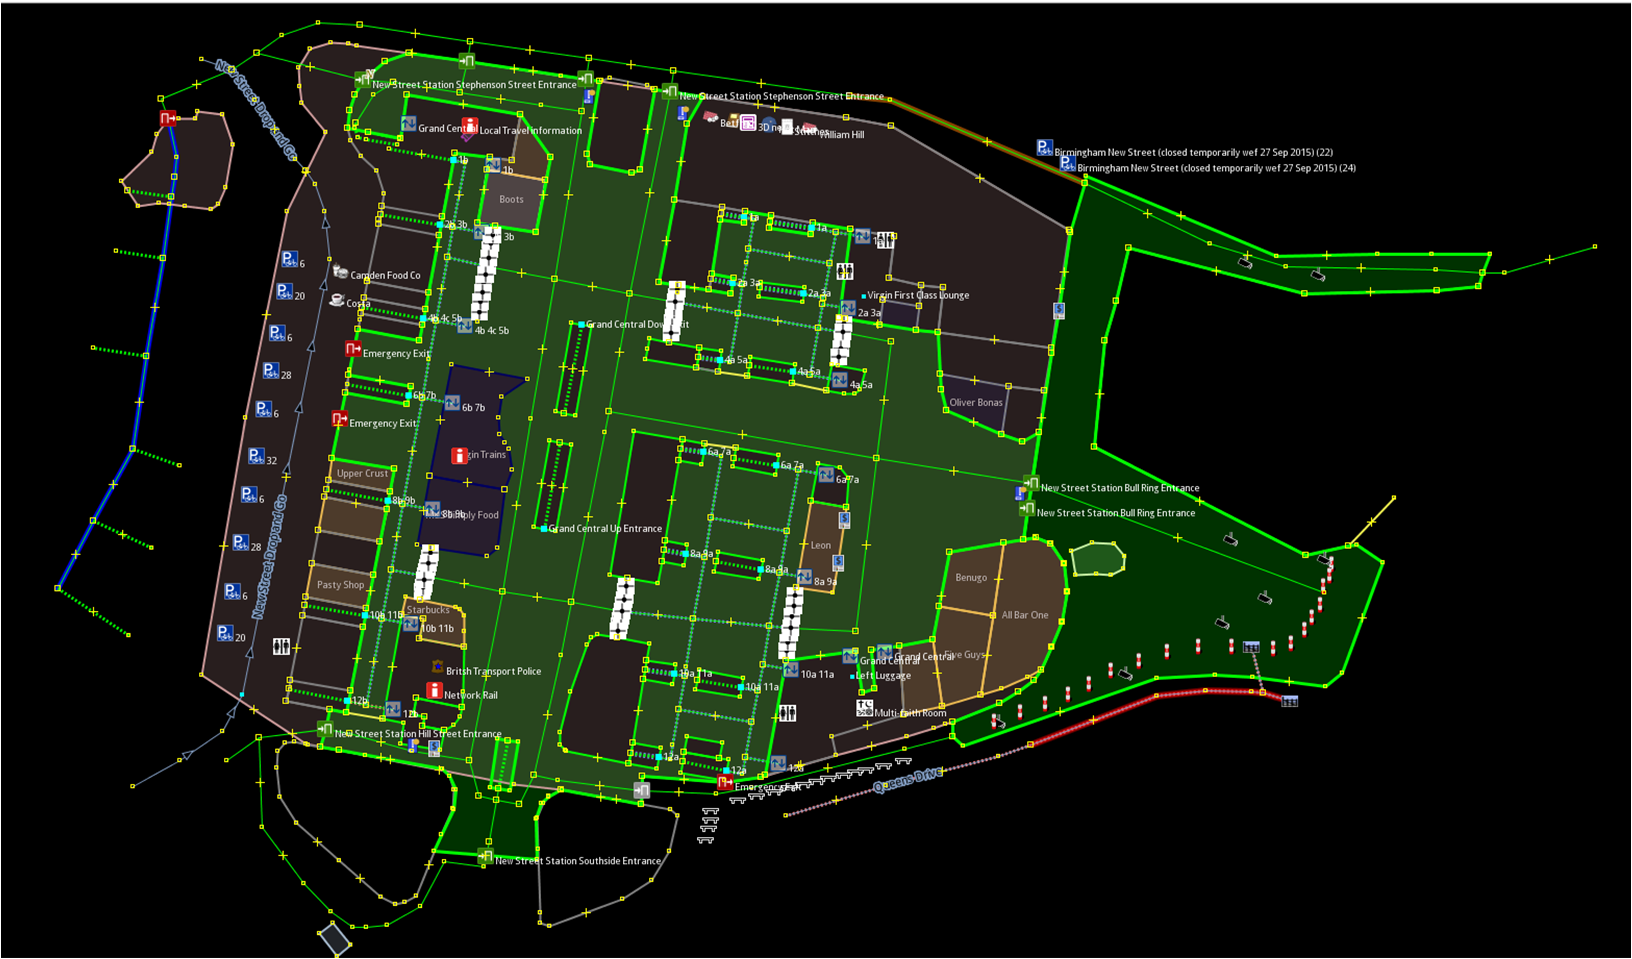
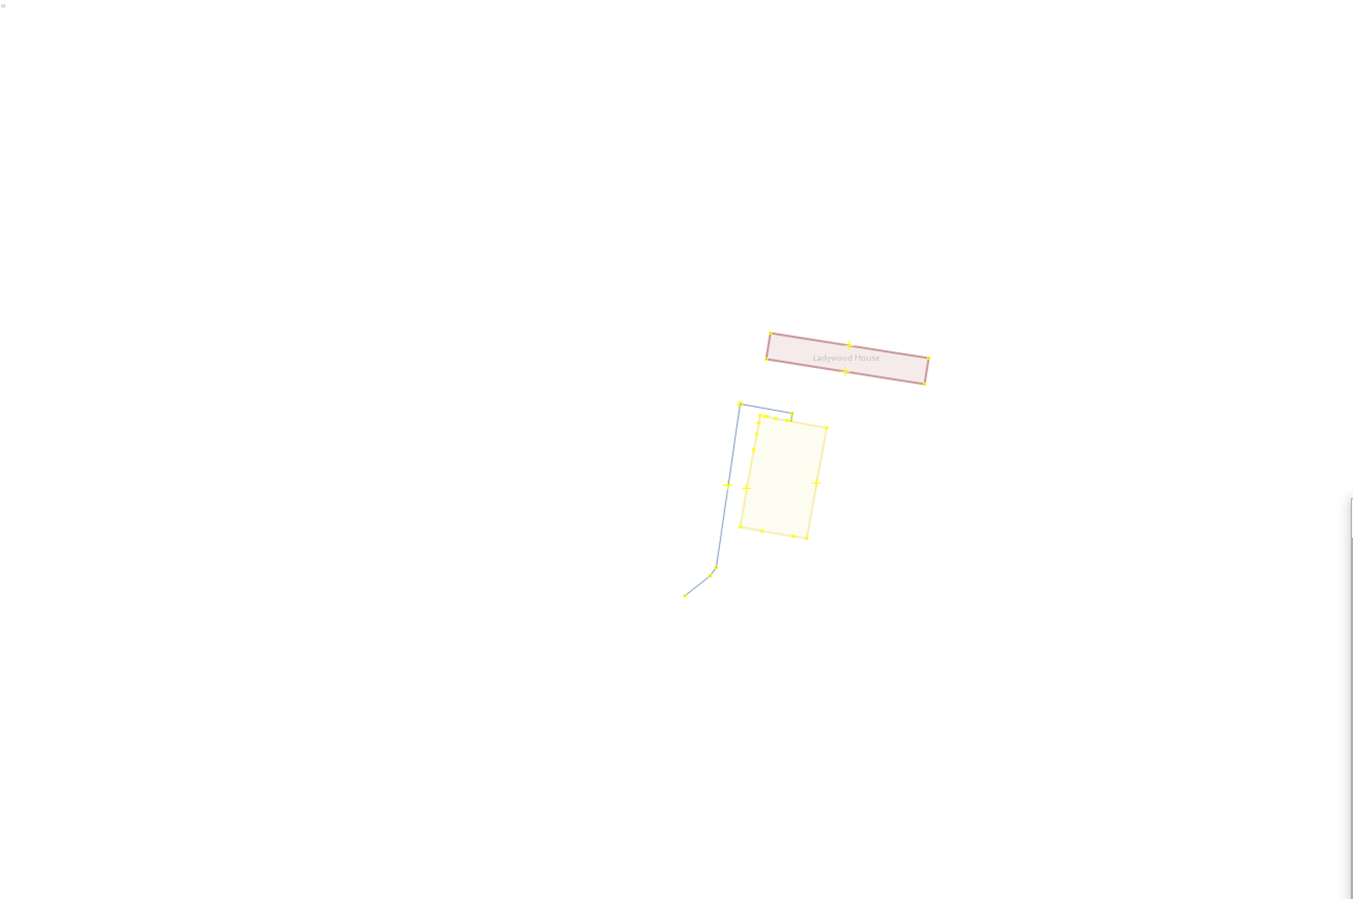
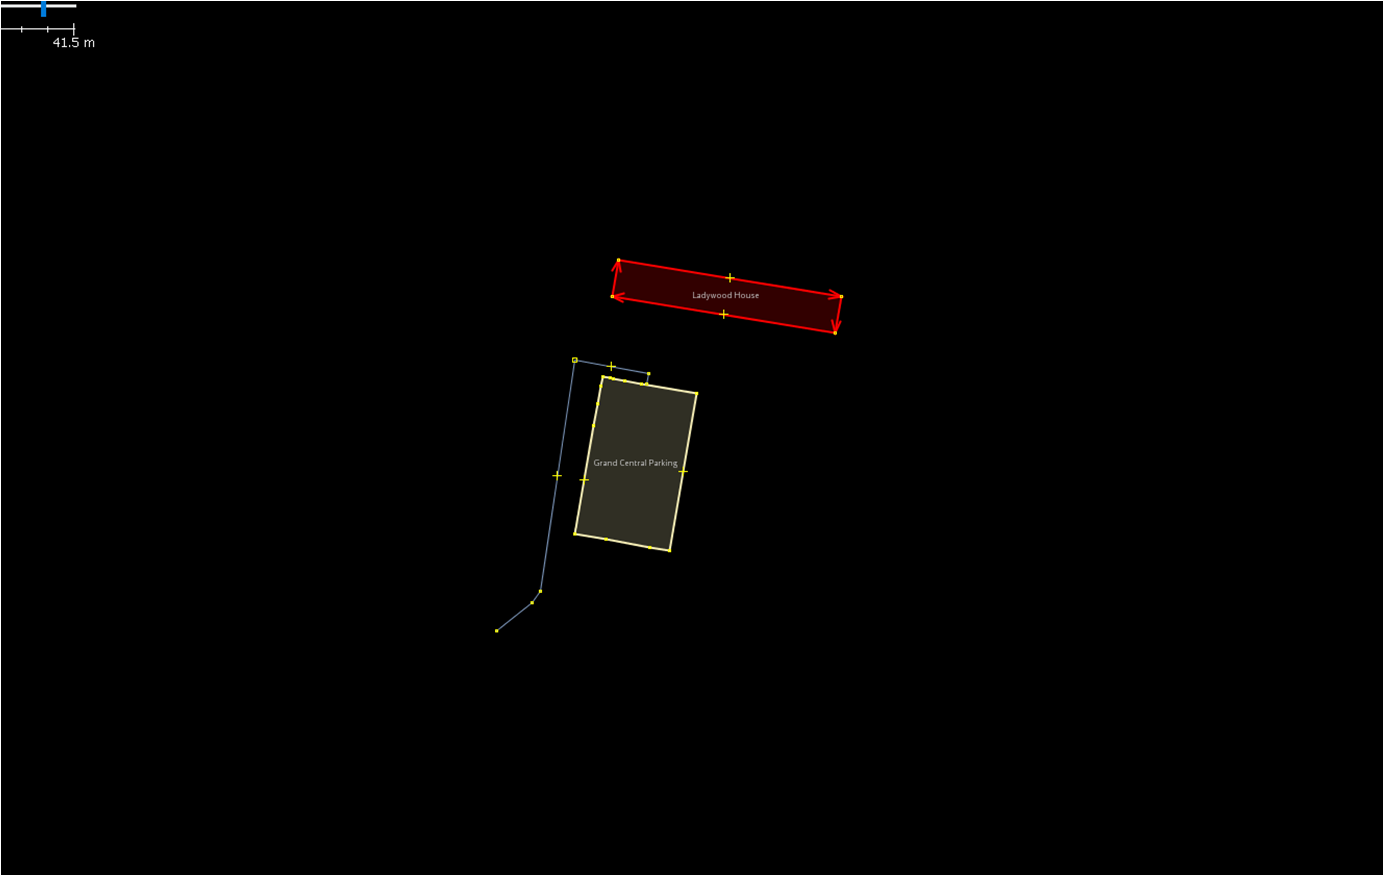
To rectify this inability to render multiple layers, I thought I’d produce some floor plans of each level, selecting in JOSM layers various tagged levels. They’re only screenshots from JOSM as my  mapping skills don’t extend to taking the data and rendering as a map- and it would just take too long to learn. If anyone else wants to have a go then please feel free! I’ve produced two versions of each, one with a dark background and one with a light background. I have done some post-editing to make the concourse more prominent rather than relying solely on the footways in the original OSM data. The plans  may prove to be more useful separated like this than trying to interpret the complexity of the standard OSM map.

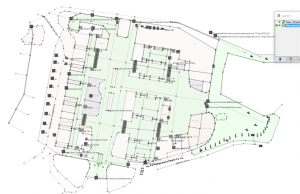
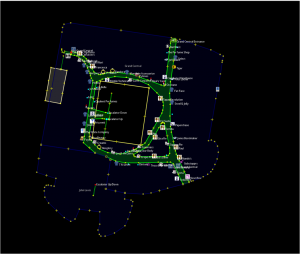
First New Street Station Concourse (at level 0)

New Street Station Concourse 4 New Street Station Concourse 3

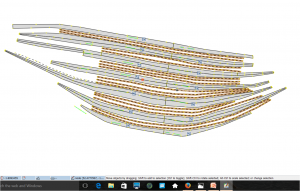
Next the platforms underneath (at level -1)

New Street platforms 2New Street Platforms 1

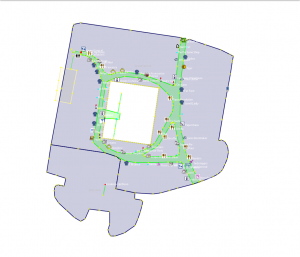
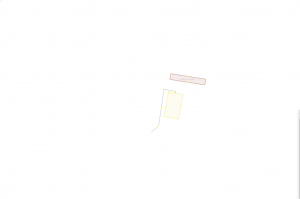
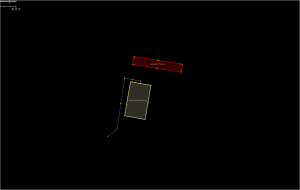
Grand Central shopping mall (above the Concourse at Level 1)
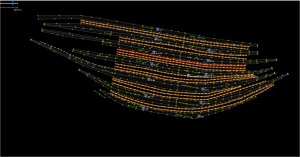
Grand Central 2 Grand Central 1

And finally Level 2

New Street Sation Level 2 2 New Street Station Level 2

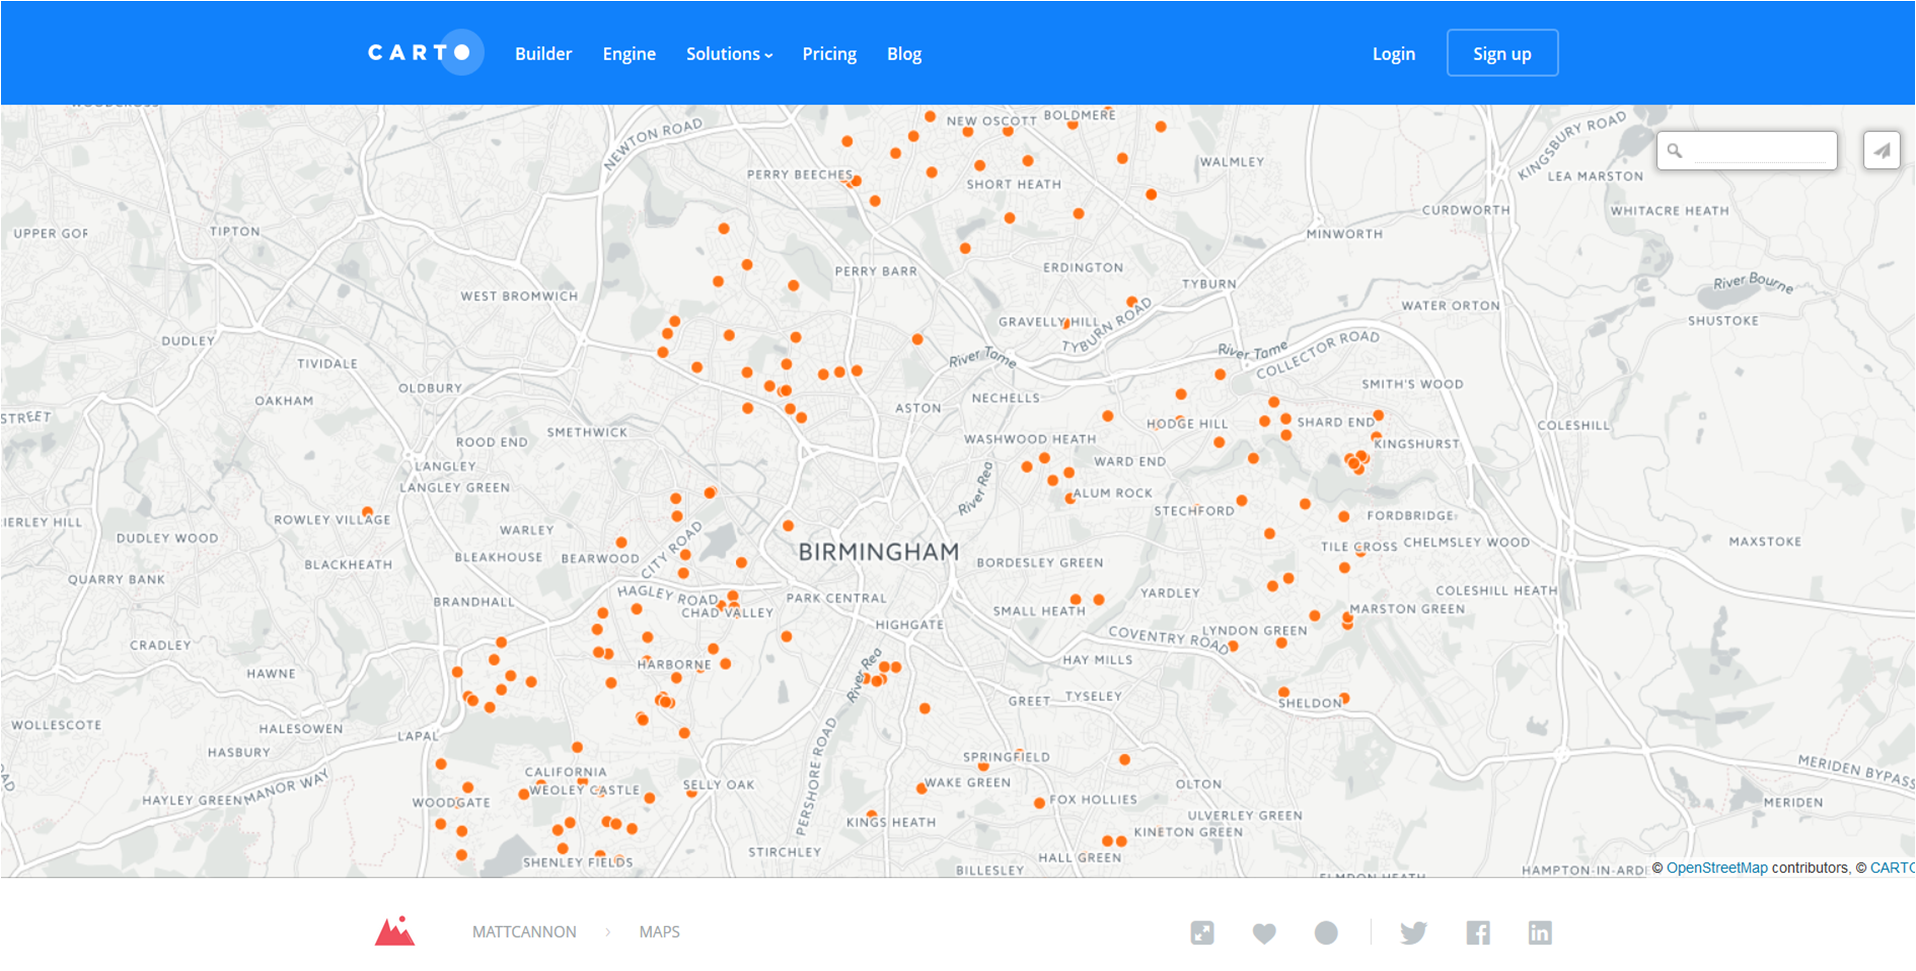
Some of these plans might make it to our mappa-mercia maps section, as a regional resource.

A few suggestions for improvements  in rendering complex public buildings like this:

  1. Display an icon and name for the entrances
  2. Display an icon for emergency exits
  3. Differentiate rendering for stairs and escalators
  4. Show direction of travel for escalators and stairs
  5. Display an icon for ticket barriers (turnstiles)
  6. Tagging schema for internal concourses and thoroughfares (maybe just add indoors=yes to highway=pedestrian and area=yes)
  7.  Opacity differentiation for multiple concourse/thoroughfare levels (even  just two would be useful)
  8. Specifically for railway stations – get the platform rendering to behave as if it understood OSM layers!

And apologies to anyone involved in indoor mapping – I found the documentation just too complex and confusing, but I’d like to learn. If anyone can review the data and demonstrate how to make a complete 3-D multilayer model I’d be very appreciative.

Winter Preparedness

posted in: Use The Map | 6

It may seem crazy talking about winter in the middle of August (unless of course you live in the southern hemisphere), however this weekend we updated our winter gritting map.

Our brand new winter gritting map.

The map shows which roads in the West Midlands are gritted when it is cold and frosty. Up until now it has required us to manually update the data each time we wanted to refresh the map. As we continue to add more winter gritting data to OpenStreetMap it makes sense to have the map auto-update. Following our own guide on how to make an always up to date map Andy Robinson developed a fantastic new winter gritting map which is available now, with ample time to spare to winter 2015/16. Thanks Andy!

Survey: A “UK/GB OpenStreetMap group”?

posted in: Mapping Party, Participate, Use The Map | 0

Dear UK/GB OpenStreetMappers,

From time to time we talk about the potential of setting up a “UK/GB
OpenStreetMap group” (name yet to be decided) but we never quite know what
it should look like.

Survey time!! Please fill in the following 2 minute survey:

http://goo.gl/forms/Z797QhC27c

Your responses to page 1 will be shared when we close the survey (in a few
weeks). If you respond to the optional page 2 questions (your details),
your responses will be used for the purpose of administrating the group
only (they will only be seen by myself and any designated administrator
should a UK/GB group be set up).

So stop reading and go to the survey:

http://goo.gl/forms/Z797QhC27c

Best regards and happy mapping,