Extracting centroids from OpenStreetMap

posted in: Use The Map | 3

This update article follows on directly from our previous article on creating an always up to date map using Overpass to extract data from OpenStreetMap and uMap to display the data on a simple zoomable map. We encourage you to read that earlier article before proceeding. In the comments I noted that I did not like how some of the data was shown as points, whilst the rest of the data was shown as polygons. Thanks to Martin Raifer (osmtogeojson) and Yohan Boniface (uMap) we can now fix that problem!

It turns out that Overpass was already able to return the centroids of polygons via use of the center output, however uMap did not yet understand the outputs. Being open source data I requested that the functionality be added to uMap. This meant first adding the functionality to osmtogeojson, the data library that uMap uses to understand OpenStreetMap data. This was achieved within a matter of days and following a quick update to uMap we’re all set to go. Let see how it works:

  • We follow the same steps as per our earlier article. Read more here.
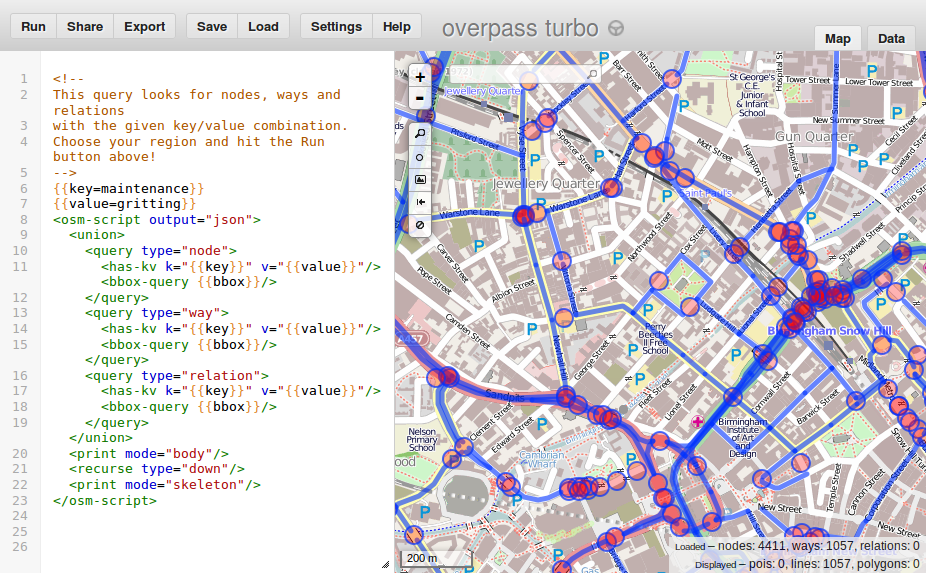
  • At step 5 we use the following adjusted Overpass data call instead (note the “center” part that requests centroid data from OpenStreetMap):
    http://overpass-api.de/api/interpreter?data=[out:json][timeout:25];node[“amenity”=”pub”]({south},{west},{north},{east});out qt;way[“amenity”=”pub”]({south},{west},{north},{east});out body center;>;out skel qt;

It’s as simple as that! Let see the result:

We think it looks great, and a lot more consistent than the mixed point and polygon map.

Update: Pop-up data

I have been asked to show how to add pop-up data to the map points. This obviously requires the data to already exist in OpenStreetMap. Assuming it does it simple to add this data:

  1. In uMap click the layers button (just under +/- ) and then click Edit (the pencil symbol).
  2. In the right hand pane scroll down to the Popup content template section of the Advanced Options.
  3. To add the pubs name and address to the pop-up simply edit this text box to include the following (based on the OpenStreetMap tags):
    # {name}
    {addr:street}
    {addr:city}

Note that only a few pubs are tagged with their full address in Stratford-upon-Avon so you may have to click on a few on the map above before you get a pop-up with all this data shown.

Creating an always up to date map

posted in: Use The Map | 12

In the previous post we showed that creating a map to show location data as a collection of pins (map markers) is easy using OpenStreetMap tools. But what if we wanted to keep that map up to date? In this article we’ll show how we keep our pubs map always up to date.

The landscape around is is always changing. Sometimes the changes are big and obvious, for example a new housing development, but changes can also be as subtle as a change in shop name. OpenStreetMap, which is commonly referred to as the wikipedia of maps, provides map data collected by a community of mappers. It emphasises local knowledge, with contributors keeping their local area up to date on the map. It is therefore the perfect source not only for the background base map, but also for the data we display on top of the base map.

Contributors use aerial imagery, GPS devices, and low-tech field maps to verify that OSM is accurate and up to date.

In the previous post we saw how uMap could be used to display map data in just the same way as Google Maps Engine/Fusion Tables. We have also previously seen how we can use Overpass to download data from OpenStreetMap. The uMap tool lets us link to Overpass to produce an always up to date map. Lets see how:

Map tutorial

Pubs are currently closing at a rate of 31 per week (source). Lets update our pubs map so that it’s automatically kept up to date by local OpenStreetMap contributors. As a secondary benefit the map will now work globally rather than just for Stratford-upon-Avon and surrounding land.

  1. Head to overpass-turbo.eu.
  2. Click Wizard and search for amenity=pub (learn about OpenStreetMap tags here)
  3. Click Export, Query, and then download/copy as umap remote data url.
  4. Paste the copied text in to a notepad and add “http://overpass-api.de/api/interpreter?data=” without quotes before it.
    1. The final result should look like:
      http://overpass-api.de/api/interpreter?data=[out:json][timeout:25];(node[“amenity”=”pub”]({south},{west},{north},{east});way[“amenity”=”pub”]({south},{west},{north},{east});relation[“amenity”=”pub”]({south},{west},{north},{east}););out body;>;out skel qt;
  5. Now navigate to umap.openstreetmap.fr or one of the alternate instances listed here.
  6. Click Create a map and pan/zoom in to the area of interest.
  7. Click the layers button (just under the +/- buttons) and then click Edit (the pencil symbol).
    1. In the right hand pane click Remote data and paste the URL we constructed in step 5 into the Url box.
    2. Select “osm” from the drop down Format list.
    3. Tick the dynamic checkbox.
    4. Optional: If you have a lot of data you may want to limit the display to certain zoom levels (so as to not put too much strain on the Overpass servers). You can do this by entering a min zoom level in the From Zoom box. Here I have entered 13 as my minimal zoom level.
  8. Customise using the options on the right. Here I’ve changed the map background to OSM monochrome and changed the colour of the overlay data.
  9. Click More on the left hand side, followed by Embed and share this map.
  10. Copy and paste the embeddable iframe (I also had to click Current view instead of default map view in the iframe options box.

The resulting map is shown below:


View full screen

Inspired to create your own map? Let us know what you make by posting a comment below or tweeting us on @mappamercia.

OpenStreetMap alternatives to Google’s Maps Engine and Fusion Tables

posted in: Use The Map | 13

Often we just want to produce a simple map showing data as a collection of pins (map markers). In this post we look at two tools that both use OpenStreetMap base maps; namely geojson.io and uMap. These are both potential alternatives to Google Maps Engine and Fusion Tables. 

OpenStreetMap has come a long way in the last 10 years; we’ve reached 1.7 million registered users, over 300,000 of whom are the last editor an an object in OpenStreetMap, and we’ve contributed over 2.4 billion nodes (points) and 248 million ways (linear features). This has led to OpenStreetMap being deployed by large companies such as Apple, Mapquest and Foursquare, and relief organisations such as Médecins Sans Frontières.

However when it comes to individuals – including those who associate themselves with the Open Source or Open Data communities – many people stick with what they know. More often that not that’s Google. OpenStreetMap is quite different; as it’s not a traditional company, most of the interesting stuff is going on outside of the core openstreetmap.org website. Let’s look at two online tools that use OpenStreetMap for the base map display.

Geojson.io

Geojson.io describes itself as “a quick, simple tool for creating, viewing, and sharing map”. It has a strong focus on input/output (io) as it supports major formats such GeoJSON, KML, GPX, CSV, TopoJSON, amongst other formats listed on the OpenStreetMap wiki. The inputs can be from a file, from a GitHub (including Gist snippets) or added manually via the website’s user interface. The final map can be exported to file, to GitHub or shared as an embeddable iframe or as a standalone URL. Visual customisation is limited to a choice of three map backgrounds.

Example:

In this example I have a geojson file of pubs in and around Stratford-upon-Avon. All the data is as points (nodes) and I want to produce a simple map to display in this blog post. Using geojson.io the steps are:

  1. Go to geojson.io.
  2. Click Open and load the source file. The map data can then be edited in the right hand pane (I used the table edit to drop some columns)
  3. Pick a map background from the choice of Mapbox, Satellite and default OSM from the options in the bottom left.
  4. Click Share and copy and paste the embeddable iframe.

Here is the result:

Quick, simple and effective.

uMap

Similar to geojson.io above, uMap describes itself as a way to “create maps with OpenStreetMap layers in a minute and embed them in your site”. It supports a number of import formats including geojson, csv, kml and also allows you to draw content directly on the map. On the export side, you can download the map data in three different file formats, or share it via an embeddable iframe or stand alone URL. Unlike geojson.io, uMap has numerous customisation options, for example you can pick from 16 map backgrounds, map data can be styled with a colour, fill opacity and line type, and the popup content can be adjusted to display additional information such as images and web links. uMap also enables you to easily work collaboratively on a map. This flexibility does however make the user interface more complicated than geojson.io’s.

Example:

This example uses a file of school locations in and around Lichfield. Most of the data is stored as polygons, however it also include point data. As before the aim is to produce a simple map to display in this blog post. Using uMap the steps are:

  1. Go to umap.openstreetmap.fr or one of the alternate instances listed here.
  2. Click Create a map.
  3. Click Import data (the up arrow icon on the right or keyboard shortcut Ctrl+I).
  4. Customise using the options on the right. Here I’ve changed the map background to MapQuest Open.
  5. Click More on the left hand side, followed by Embed and share this map.
  6. Copy and paste the embeddable iframe (I also had to click Current view instead of deafult map view in the iframe options box.

Here’s the result from uMap:

Advanced, customisable, and featureful.

Tell us what you think

Have a go and let us know what you think. How do they compare with what is available from Google or others, and what would make them better. Drop us a line in the comment box below or via our twitter account, @mappamercia.

Improving TagInfo

posted in: Use The Map | 0

TagInfo is a website that allows you to explore tag usage statistics in OpenStreetMap. That is, unlike the wiki documentation which describes how tags should be used, TagInfo reports on how tags are actually being used in OpenStreetMap.

I’ve previously written a bit about TagInfo in “Exploring OpenStreetMap Data” and I’m pleased to see that TagInfo continues to be improved with new features. One of these features was suggested by our own Andy Mabbett – lets take a look.

Comparing Keys and Tags

It is now possible to compare tags side by side on a single page. A new menu on tag (and key) pages allows you to add those tags to a comparison list and then compare them side by side. This new addition is great when when trying to decide which of several similar tags is best to use based on popularity/existing use.

Comparing two tags side by side in TagInfo.

Well done Andy for proposing this new feature, and a big thank you to Jochen Topf for implementing it so quickly.

Other new features

The tag comparison is not the only new update to TagInfo. Today the following updates were also added:

  • Maps for Tags
  • Link to Level0 Editor
  • Improved Overpass Turbo Integration

In addition to the above improvements, there are also changes to the API and new translations (you can help with translating TagInfo here).

TagInfo is a great tool to help OpenStreetMappers, so I’d personally like to thank Jochen for his work on this. TagInfo is now a core feature of OpenStreetMap (now being hosted on OpenStreetMap Foundation servers). This is a great accolade for TagInfo as it signifies that the website is at the heart of the OpenStreetMap landscape and will continue to be supported going forward.

Not all Notes are equal

The Notes feature available on the OSM home page is a great way to encourage non-mappers to add comments and point our errors and omissions (it’s also a great method for mappers too!)

BUT …. now all the extant OpenStreetBugs Notes have migrated over , some of which are YEARS old, it’s all getting a bit crowded and hard to differentiate new notes.

I like to view new notes and try to encourage those who have added them to add more by either amending the map where it’s obvious what’s needed or I know the area; doing a ground survey if it’s close or adding a comment where the note is not clear. The encouragement only works if the note is acted on quickly.

So I have a proposal whereby notes are differentiated by age, gradually fading in colour as they age until they turn white , (much like us really!)

 So for example new notes get a bright colour on the day they’re created, then fade at week, month, 3 month, 6 month old until they become white after a year. I’m sure that to those who code such things this is not a major task

Welcome again to Mappa‑Mercia.org

posted in: Participate, Use The Map | 0

Welcome to our new website. It’s taken us over a year to discuss, design, write and migrate from our old one – but we do have the excuse of organising OpenStreetMap‘s international conference State of the Map 2013 in Birmingham in September 2013. A not inconsiderable task which quite naturally took almost all of our time and energies. So good luck to the organisers of SotM 2014 in Buenos Aires and those organising regional conferences in Europe and the US – we know how much hard work it is!

Screenshot of our new website. Keep an eye open for more improvements in the coming weeks.
A screenshot of our new website. Keep an eye open for more improvements in the coming weeks.

Anyhow back to our website. We hope you like it. We’ve tried to give more prominence to the social element of mapping and given slightly less prominence to maps. It’s also displays great on tablets and smartphones. We have plans to enhance its content over the next few weeks.

And our blog is now re-open for business so expect regular updates from the Midlands – they might revive pleasant memories for those of you who attended SotM 2013 in Birmingham. We hope they inspire local mappers to continue their sterling efforts.

Conference: State of the Map 2013

posted in: Mapping Party, Participate, Use The Map | 0

Many of you will have already heard the great news, but for those who haven’t, I am pleased to announce that OpenStreetMap’s annual conference will be held in Birmingham, from 6th – 8th September 2013.

The conference, known as State of the Map 2013 (SotM 2013), will see 300 users converge on Birmingham to discuss everything OpenStreetMap. It’s been 6 years since the conference was last held in the UK and in that time OpenStreetMap has developed from a project with 10,000 contributors, to one of 1.05 million registered users. To reflect on this huge growth, this years theme is “Change”.

Simon Poole, Chairman of the OpenStreetMap Foundation reflects:

“Change is a constant in OpenStreetMap. Not only does the world around us change and require resurveying all the time, the OpenStreetMap project itself continues to evolve very rapidly in every aspect. The organisation that is returning to the UK with its main public event after 6 years, has grown from a small, fun project, to an undertaking that is competing with multi-billion dollar corporations but still is fun for everybody involved. In that vein I’m looking forward to SOTM in Birmingham and expect that we will all have a great and interesting time.”

Being such a big event, we are delighted that we are not alone in organising the conference. In addition to regular Mappa Mercia members, we also have the support of many other OSMers from both inside the UK and around the world. Thank-you for all your input.

For more info see: stateofthemap.org

Exploring OpenStreetMap data

posted in: Use The Map | 0

In my December and January blog posts about Maperitive, I discussed how to download OpenStreetMap data. The first method used the “export” feature on the osm.org homepage to download all data within a geographic area, whilst in my second post we used the Overpass XAPI Compatibility Layer to download just those ways (polylines) tagged as gritting routes.

In this post we will explore how to find out more about OpenStreetMap tags and how we can visualise the data online.

OpenSteeetMap Wiki

The OpenStreetMap Wiki is the main documentation portal for OSM. The Map Features page provides an initial list of tags, with links to detailed pages about man tag keys and values (recall that all tags are in the format key=value). For example the tag “highway=footway” has a wiki page all about the key “highway” (see Key:highway), in addition to a page specifically about the “footway” value (see Tag:highway=footway).

Note that the wiki should be considered as a guide only. Not all tags are documented and some tags are marked as “proposals” only. Use the search bar in the top right to help discover related pages.

TagInfo

On both Key and Tag wiki pages, you will often find a box on the right hand side which includes a subsection titled “TagInfo”. This provides stats about how many nodes (points), ways (polylines) and relations (multipolygons) are tagged with that key/tag.

TagIfo screenshot.
TagInfo stats on the highway=footway wiki page.

TagInfo is a separate website that reports on how tags are actually being used in OSM. By examining the raw data it provides stats about all tags used, not just those with documentation. It also provides information about common tag combinations. So for example we can see here that the the “highway=footway” tag is often combined with tags about the surface and bicycle use. We can also see a static global map of where the highway key is used (see here).

Overpass Turbo

Overpass Turbo is a web based interface for the Overpass API download servers. With turbo you can run any kind of Overpass query and display the results an interactive map. As such it provides greater visualisation of the data than TagInfo’s basic static map. Be warned however that this should be used for small quantities of data only (that is, infrequently used tags, or if using common tags the interactive map should be well zoomed in). It is also not as simple to use as TagInfo, however each TagInfo page includes a link to turbo (a button with a steering wheel on it) that will pre-populate turbo with the correct query. You just need to zoom in and click “Run”.

Screenshot of Overpass Turbo.
Overpass Turbo query showing gritting routes in Birmingham

Once you have investigated the OpenStreetMap data you can move on to download it using the Overpass XAPI Compatibility Layer or use the Overpass API queries as shown in the example above.

Maperitive: Creating your own rendering rules

posted in: Use The Map | 1

In my previous post entitled “Maperitive: My first map render”, I introduced the concept of creating your own map style using the offline tool, “Maperitive”. At the time we looked at a very simple example of downloading a geographical region of OpenStreetMap data, loading it into Maperitive and drawing (rendering) your own map using the built in rendering rules.

In this follow up post we will explore the idea of creating your own basic rendering rules in order to highlight specific map features. As coincidence will have it, at Mappa Mercia’s last monthly meet-up we spoke about rebooting the main mappa-mercia.org website no that our original maintainer is no longer living in the UK. I will therefore look at the gritting map as an example.

Step 1. Downloading the data

Before we can get started on writing the rendering rules we must first download the required OpenStreetMap data and understand the tags – after all it is the tags that drive the rendering rules!

To do this we are going to use the Overpass XAPI. This enables us to download a subset of data based on a specified tag and geographical region (defined by a rectangular “bounding box”). In this example we will download all ways with the tag “maintenance=gritting” that fall within a sample are of Birmingham. Copy and paste the following web address into your browsers URL box and save the resulting file as “gritting.osm”:

http://www.overpass-api.de/api/xapi?way[bbox=-1.93,52.4,-1.79,52.5][maintenance=gritting][@meta]

As you can see, the web address used to download the required data is easy to understand and adapt to other uses. The geographical region is specified by “[bbox=-1.93,…] ” and the download is restricted to only ways with the tag “[maintenance=gritting]”. Finally [@meta] is used to download the additional metadata required to open the file in JOSM.

For more examples, see the wiki entry for Overpass XAPI. Other ways to download OpenStreetMap data can be found here.

Step 2. Examining the data

If we open the resulting “gritting.osm” file in JOSM (or if you already know the data well enough), we find that all gritting routes are tagged with a priority from 1 to 3. For example, “gritting=priority_1”. We will therefore set up our rendering rules in order to create map showing these as colour coded routes.

The output map as rendered by Maperitive.

Step 3. Writing the rendering rules

Maperitive rendering rules specify what gets drawn on the map and how it gets drawn. You start writing rules by specifying “features”. A feature could be a forest, a motorway, a bench. This answers the “what?” part. After that, you specify the actual “rules” for these features. This answers the “how?” part.

Rules are specified in a simple text file and can be edited with a text editor. Within the “Rules” folder of your Maperitive installation, create a text file called “gritting.mrules” (note that in Windows you may have to change a setting so that file extensions are visible) and copy the following text into the file:

features
    lines
        gritted route : maintenance=gritting

rules
    target: gritted route
        define
            line-opacity : 0.75
            min-zoom : 5
            line-width : 5
        for : gritting=priority_2
            define
                line-color : blue
        elsefor : gritting=priority_3
            define
                line-color : royalblue
        else
            define
                line-color : red
        draw : line

In the top section, we are defining that we wish to create a line feature called “gritted route” and that only ways tagged as “maintenance=gritting” belong to this group. In the lower section we define rendering rules for the feature. All gritted routes are drawn with the same line opacity, minimum zoom and line width, however we separate out line colour according to the priority tag. In my test, it would appear that any HTML colour name is allowed (?). For more on rendering rules, see the Maperitive guide.

Step 4. Create your map

We’ve downloaded the OpenStreetMap data and written some basic rendering rules. All that remains is to generate our map. Open Maperitive and load the “gritting.osm” file using File->Open Map Sources…. The final step is to tell Maperitive which rendering rules to use. To do this enter the following two lines (one at a time) in Maperitive’s Command Prompt:

use-ruleset location=Rules/gritting.mrules
apply-ruleset

Finally we can export the map as a PNG image by using Tools->Export To Bitmap. The location in which the image file was saved is shown at the bottom left, as the final line in the Commander

Heritage mapping

posted in: Use The Map | 3

Finally, after a couple of years surveying listed buildings, parks and gardens an public artworks, amassing along the way a vast collection of photos; we’ve managed to get a prototype map showing everything of “heritage”  or “cultural” status in the West Midlands.

There doesn’t seem to be anywhere with one source that you can go to to visualise all this data and how each point relates to another. You can search and find individual points which is time consuming and requires some prior knowledge. But once you’ve found an interesting artefact you’re at a loss to know what else is close by, so that if you plan a visit you might miss something just as interesting nearby, or fail to put your chosen artefact into its proper context.

The data is a mixture of OSM data and government data from English Heritage. The English Heritage data is what we’ve come to expect from government data – it’s about 95% accurate and about 95% complete (not a mathematical analysis just a “feel” for the data based on errors discovered so far). Getting that last 5% just seems to be too much effort and too much expense! But thanks anyway to English Heritage for finally publishing the data under an open licence.  OSM data was extracted using osmfilter and then converted to csv format using osmconvert -two very useful tools, even if getting used to a command line interface was a bit tedious at first – so congratulations to the authors.

We’ve used TileMill and MapBox mainly because of the excellent initial free hosting and the ease of learning the editing tools – still a steep learning curve but nowhere near as steep as some map-making tools. TileMill has its limitations but it’s a great introduction to keen mappers who are not skilled software developers. So congratulations to MapBox and don’t worry about it looking daunting once you’ve started:  their support is excellent and not at all condescending to newbies.

This is what it looks like and you find the service here.

Our service is still evolving and is nowhere near fully populated – most interesting feedback so far is the level of satisfaction with the pop-up boxes being set to the side of the map not over the marker, obscuring the surrounding area. We’re hoping to get local conservation bodies interested and one has already responded positively.