In my December and January blog posts about Maperitive, I discussed how to download OpenStreetMap data. The first method used the “export” feature on the osm.org homepage to download all data within a geographic area, whilst in my second post we used the Overpass XAPI Compatibility Layer to download just those ways (polylines) tagged as gritting routes.
In this post we will explore how to find out more about OpenStreetMap tags and how we can visualise the data online.
OpenSteeetMap Wiki
The OpenStreetMap Wiki is the main documentation portal for OSM. The Map Features page provides an initial list of tags, with links to detailed pages about man tag keys and values (recall that all tags are in the format key=value). For example the tag “highway=footway” has a wiki page all about the key “highway” (see Key:highway), in addition to a page specifically about the “footway” value (see Tag:highway=footway).
Note that the wiki should be considered as a guide only. Not all tags are documented and some tags are marked as “proposals” only. Use the search bar in the top right to help discover related pages.
TagInfo
On both Key and Tag wiki pages, you will often find a box on the right hand side which includes a subsection titled “TagInfo”. This provides stats about how many nodes (points), ways (polylines) and relations (multipolygons) are tagged with that key/tag.
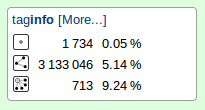
TagInfo is a separate website that reports on how tags are actually being used in OSM. By examining the raw data it provides stats about all tags used, not just those with documentation. It also provides information about common tag combinations. So for example we can see here that the the “highway=footway” tag is often combined with tags about the surface and bicycle use. We can also see a static global map of where the highway key is used (see here).
Overpass Turbo
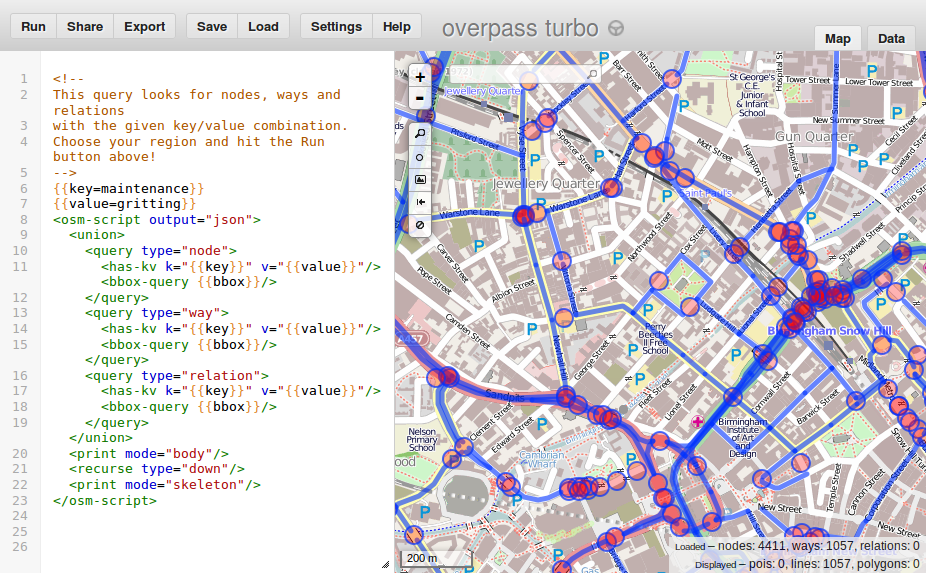
Overpass Turbo is a web based interface for the Overpass API download servers. With turbo you can run any kind of Overpass query and display the results an interactive map. As such it provides greater visualisation of the data than TagInfo’s basic static map. Be warned however that this should be used for small quantities of data only (that is, infrequently used tags, or if using common tags the interactive map should be well zoomed in). It is also not as simple to use as TagInfo, however each TagInfo page includes a link to turbo (a button with a steering wheel on it) that will pre-populate turbo with the correct query. You just need to zoom in and click “Run”.
Once you have investigated the OpenStreetMap data you can move on to download it using the Overpass XAPI Compatibility Layer or use the Overpass API queries as shown in the example above.
Leave a Reply
You must be logged in to post a comment.