Welcome again to Mappa‑Mercia.org

posted in: Participate, Use The Map | 0

Welcome to our new website. It’s taken us over a year to discuss, design, write and migrate from our old one – but we do have the excuse of organising OpenStreetMap‘s international conference State of the Map 2013 in Birmingham in September 2013. A not inconsiderable task which quite naturally took almost all of our time and energies. So good luck to the organisers of SotM 2014 in Buenos Aires and those organising regional conferences in Europe and the US – we know how much hard work it is!

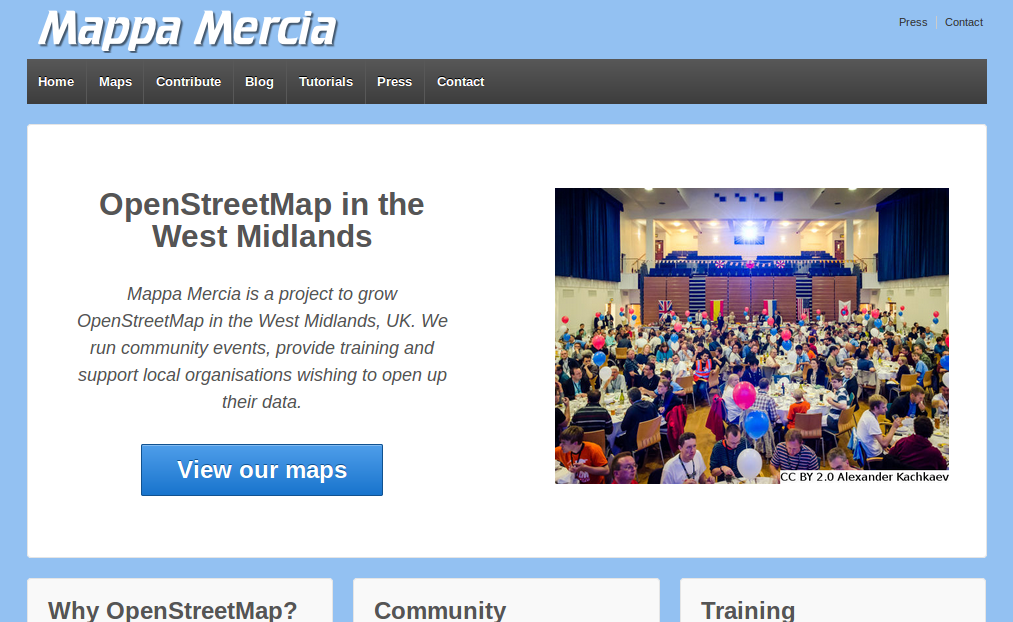
Screenshot of our new website. Keep an eye open for more improvements in the coming weeks.
A screenshot of our new website. Keep an eye open for more improvements in the coming weeks.

Anyhow back to our website. We hope you like it. We’ve tried to give more prominence to the social element of mapping and given slightly less prominence to maps. It’s also displays great on tablets and smartphones. We have plans to enhance its content over the next few weeks.

And our blog is now re-open for business so expect regular updates from the Midlands – they might revive pleasant memories for those of you who attended SotM 2013 in Birmingham. We hope they inspire local mappers to continue their sterling efforts.

Conference: State of the Map 2013

posted in: Mapping Party, Participate, Use The Map | 0

Many of you will have already heard the great news, but for those who haven’t, I am pleased to announce that OpenStreetMap’s annual conference will be held in Birmingham, from 6th – 8th September 2013.

The conference, known as State of the Map 2013 (SotM 2013), will see 300 users converge on Birmingham to discuss everything OpenStreetMap. It’s been 6 years since the conference was last held in the UK and in that time OpenStreetMap has developed from a project with 10,000 contributors, to one of 1.05 million registered users. To reflect on this huge growth, this years theme is “Change”.

Simon Poole, Chairman of the OpenStreetMap Foundation reflects:

“Change is a constant in OpenStreetMap. Not only does the world around us change and require resurveying all the time, the OpenStreetMap project itself continues to evolve very rapidly in every aspect. The organisation that is returning to the UK with its main public event after 6 years, has grown from a small, fun project, to an undertaking that is competing with multi-billion dollar corporations but still is fun for everybody involved. In that vein I’m looking forward to SOTM in Birmingham and expect that we will all have a great and interesting time.”

Being such a big event, we are delighted that we are not alone in organising the conference. In addition to regular Mappa Mercia members, we also have the support of many other OSMers from both inside the UK and around the world. Thank-you for all your input.

For more info see: stateofthemap.org

Rural Mapping

posted in: Participate | 1

In the West Midlands we’ve been busy with rural mapping. To those of you surprised that there’s any countryside in the sprawling industrial conurbation that spreads from Wolverhampton through Birmingham and Solihull into Coventry, we need only quote the motto of Solihull which is Urbs in Rure (Town in Country). You will see that there is a large amount of green belt land that has been jealously guarded by planning authorities. The green belt land provides much needed recreational access for the surrounding population. It will come under increasing pressure from the new relaxations on planning restrictions.

In a COUNTRYSIDE TRIAL AREA to the eastern end of Solihull and the Western end of Coventry bounded by A45 / Birmingham Road Meriden / Berkswell Road / Meriden Road / Coventry Road / Broad Lane / Eastern Green estates / Allesley Green estates, mappa-mercia mappers have collaborated to produce a rural map to the most detailed level currently available within OSM.

Guidelines

The guidelines which we evolved by discussion, some concentrating on mapping landuse and others on mapping footpaths, are as follows:

1. All field boundaries are shown using the predominant feature defining it to someone in the field. The most useful are: 
– barrier=hedge
– barrier=fence
– waterway=stream (NB: if a stream also has hedge one side and fence the other we only show more than one if it is necessary to make situation clearer).
– highway=service (or higher – only show barrier as well if necessary)
– boundary between landuse=residential and landuse=farmland (NB – these are not so easy to see and therefore adding a barrier as well is desirable, or for “MapQuest Open” type rendering, essential.

2.   Adding the main buildings within a residential area is desirable in order to give as god idea what the area looks like. We  have tried to add all houses, and usually all similar sized or larger buildings to all small areas of landuse=residential. In some cases we have added all buildings and the dividing hedge/fence between plots, but regard this as optional and maybe overkill/over use of memory/rendering-CPU-time/etc. In larger residential areas such as Meriden and Berkswell we have not added any buildings to contrast village with hamlet/mansions/etc., but would welcome other local editors to take on such tasks over time. In larger areas still, it is obvious by adding all the residential roads that the grey area is residential. Buildings for farm use are default labelled as building=agricultural, unless the specific use is known, e.g building=glasshouse

3.   We have  tried to give a landuse to all light grey areas other than the verges of roads and some tracks and footpaths. Sometimes this needed lateral thinking to define an area by its major use to avoid leaving light grey bits of scrubland, etc.

4.  Being surrounded by large residential areas where horse riding is popular amongst the residents there is  a large amount of farmland devoted to grazing and exercising horses: these we have differentiated by using landuse=meadow. It is often hard to get this right, for example the meadows north of Pickford Grange Farm are usually full of horses, but checking with Google StreetView shows cattle in the eastern 2 or 3  so we’ve left them meadow). There are other areas which are probably anomalies but regular ground surveying and more discussion will eventually clear these up.

5. Landuse=forest has only been used where it is obvious by the regular pattern of the trees that it  is a planted and managed area of trees. All other wooded areas are tagged natural=wood. Currently we are not sure that we have been totally consistent here. There can also be ambiguity between a line of trees, a thin wood and a thick hedge,especially along watercourses. Much here is a matter of styles between individual mappers.

Issues

A. The brown colouring of the farmland we hope one day soon be made lighter/brighter. The current brown is not, to us, aesthetically pleasing, and  makes seeing highway=footway paths hard to see. The residential grey has almost as bad an effect. 
It may be a good idea to render footways somewhat wider (especially at larger scales), and/or increase the width of lightening the background which works so well with woods and forests.

B.  We have been adding a lot more of the stiles and kissing gates. Unfortunately the latter do not get rendered whereas gates, bollards and stiles do. Kissing gates locations are useful to know if you need to navigate with persons who can walk adequately but have mobility difficulty in crossing stiles or you have a very large dog which you can’t lift over stiles bit you can get though kissing gates. We can’t rely on the absence of stiles on the map to infer a walkable  route in these circumstances (incomplete surveying), but the explicit rendering of kissing gates would be a great asset.

When is a boundary not a boundary?

posted in: Participate | 5

Boundaries, be they land ownership or administrative boundaries, form an essential part of geo-data. Was it therefore a success for the open data campaign when Ordnance Survey released the Boundary-Line product, containing all electoral and administrative boundaries, under the OS OpenData Licence? Not Quite.

The problem is that boundary is the “Boundary-Line” data are not boundaries! There are two issues, and these apply to all geospatial data released as independent vector layers; scale and context.

Scale

Large scale maps (such as walking maps), have a higher resolution than medium, or small scale maps (such as country of global maps). The larger the scale, the higher the resolution and therefore the more detail shown. As boundaries twist and turn following streams, rivers and hedges, it is important to use a large scale/high resolution. The Ordnance Survey provide boundary data in two products; the free “Boundary-Line” product, and the non-free “OS MasrterMap” product. According to Ordnance Surveys own admission:

Boundary-Line is captured against a lower resolution mapping backdrop and the boundaries are captured to represent the data at a nominal 1:10000 viewing scale. The process of generalising the data may have caused some features to be moved from their true ground position for the purpose of map clarity.

So scale, or to give it it’s proper name, generalisation, is the first problem we should be aware of before using Boundary-Line data in OpenStreetMap.

Context

Lets see what Ordance Survey have to say about their other boundary product – OS MasterMap:

OSMM Topography Layer currently holds the definitive and more accurate boundary information as the boundaries are mered (aligned to) real-world features on the ground. Captured at mapping scales of 1:1250, 1:2500 (for urban areas) and 1:10k (for rural).

Okay, we can see that MasterMap uses a larger scale / higher resolution which helps provide more accurate data, but what is that reference to “mereing” (alignment). Mereing, is the process of establishing a boundary relative to ground features present at the time of a survey (source: ESRI). As such any boundary line extracted from a map of any resolution cannot therefore be used on its own to describe a boundary – once you extract the boundary, you loose the context provided by the rest of the map!
Lets look at an example.

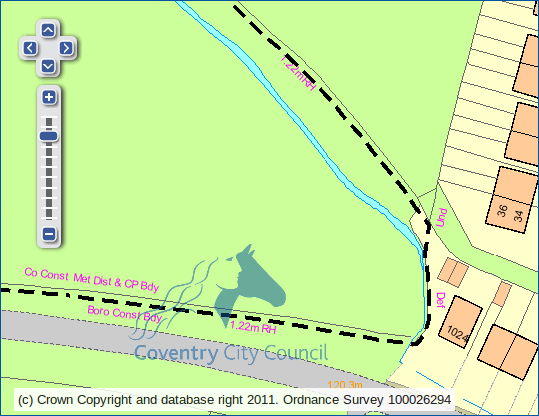
For illustration purposes only (courtesy of Ordnance Survey and Coventry City Council).

In the example above we see the boundary as a black dashed line. Along the line are some descriptions in pink. The first couple are relatively easy to decipher – “Co Const Met Dist & CP Bdy” is shorthand for County Constituency, Metropolitan District and Civil Parish boundary. Similarly “Boro Const Bdy” tells us it is a Borough Constituency boundary. As we follow the boundary we reach more abstract shorthand:

  • 1.22m RH – RH stands for Root of Hedge, and 1.22m equates to exactly 4ft. The boundary is therefore 4ft away from the stem line of the hedge. This unusual convention comes from the presumption that landowners planted hedgerows slightly in from the edge of their land so as to not encroach on their neighbours plots. The distance differs between 3ft and 5ft depending on which parish the land lies within.
  • Def – This is a “defaced boundary”, meaning that the original feature that the boundary was aligned to no longer exists. This was probably a hedge that was removed when the houses were built. Had the hedge roots not been removed then the boundary would be marked as “Tk H” implying track of hedge.
  • Und – An “undefined boundary” is one where there was no real-world feature to align the boundary to when it was surveyed.

For a list of abbreviations click here.

Conclusion

Any vector extract of boundary data will be problematic due to generalisation (scale) and the loss of information about mereing (loss of context). If you are really keen on determining the exact boundary you may want to read more about boundary presumptions or go and dig out the original surveyors notes (Perambulation Cards) at the National Archives.

Discussion

So for OpenStreetMap should we be linking boundary ways to streams and hedges on the acknowledgement that Boundary-Line data is not perfect and we are not able to provide any certainty as to which side of the hedge the boundary actually resides on? Please leave your thoughts as comments below.

Mapping transverse steps

posted in: Observations, Participate | 3

How do you map steps that are transverse like these? This is a view towards Birmingham Central Library from Victoria Square and is a route traversed by thousands of people a day.

Currently highway=steps is for a set of steps along a linear way which doesn’t address this scenario which must occur tens of thousands of times across the planet.

There is a tagging proposal which as been around for a couple of years which seems to be going nowhere. I’ve read it and it’s far too complex for  me and I would guess most mappers.

Solving this problem is important a) for accurate mapping and  b) for disabled/visually impaired routing.

Perhaps a simple tagging scheme of highway=steps steps=transverse with the left hand side of the way being the top with a rendering of the current steps render with little arrows pointing in the downwards direction across the way?

While we’re at it perhaps the existing linear steps render could be improved with an arrow indicating down? But maybe that would be confusing with the one way render for streets/roads.

All Change for Birmingham City Centre Buses

posted in: Map Improvements, Participate | 3

A mapper’s job is never finished! For those of you who might think that the UK and Western Europe are pretty much complete and we don’t have much to do – there’s ALWAYS something changing somewhere.

Today, Sunday 22 July, is the culmination of several months of planning and roadworks to complete a major reconfiguration of Birmingham City Centre’s  bus stops which bans buses from the City Centre, grouping bus stops into 5 separate Interchanges on the periphery of the business/retail downtown area.

This has been done firstly to improve traffic flow on the bus network and secondly to free up streets for a Metro line extension from Snow Hill railway station to New Street railway station (so more changes for us later)

We’re proud to say that we have completed mapping and editing 80% of the changes today. ALL the physical changes have been surveyed, mapped and edited: what’s holding us back is untangling and re-routing the relations for bus routes. Another example of the combination of dedicated local mappers, OpenStreetMap and the editing tools at our disposal, being unbeatable!

The 2 organisations responsible, Network West Midlands and Centro, have published very good information and their staff have been very co-operative. Birmingham was blanketed with their staff today, helping out hapless passengers, who despite a week of blitz publicity, were still very confused. We made contact with the staff responsible for the data, swapping information about  our queries from ground surveys. We also got from them a rough timetable for the rollout of some additional, new bus stops. Hopefully we can build on this contact and keep up to date with future changes.

To get a feel for the surveying/mapping/editing effort:

  • 24 bus stops removed/deleted
  • 10 new bus stops added
  • 126 bus stops changed name
  • 5 new bus-only road links built
  • 1 dual carriageway reversed
  • 1 new car park access road added
  • 2 taxi ranks moved/removed
  • 3 streets reversed oneway direction
  • 3 streets pedestrianised
  • 89 bus route relations checked/revised

If you want the official version of the changes go to http://www.connectedcity.org.uk/

What lies beneath?

I know we have enough on our hands with mapping what we can see: but what about what’s under our feet (or wheels)?
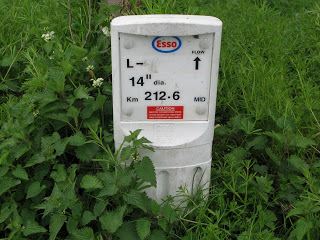
On my travels around the West Midlands countryside I regularly come across pipeline markers like the one illustrated. Depending on my route I can often join up the markers to trace the corresponding  underground pipeline. The oil pipelines carry a  lot of information as you can see which is why they get photographed.

They are a lot less common than the gas pipeline markers which are a boring white pipe about 2.5m high with a fluorescent orange top. These carry a lot less information just usually who you can ring in an emergency. Some have serial numbers but  by no means all. Where one can be seen in the distance but can’t be reached because there are no rights of way to it , the fluorescent marker allows a compass bearing to be taken and a distance estimated for later editing against Bing imagery.

Some pipeline markers have bright fluorescent roofs on them making them look like an arrow pointing skywards. They are numbered and are apparently designed for locating by aerial imagery, although I’ve yet to be able to discern one at Bing’s resolution.

The West Midlands has several oil pipelines crossing it, with at least 4 large oil terminals: BHX Airport; Kingsbury; Fort Dunlop; and Bedworth in our region so we get to see a lot of pipeline markers.

Linewatch runs an excellent website with information to help in preventing builders and civil engineers digging up and damaging pipelines. The page here has a great collection of pictures of what the different companies’ markers look like. In urban locations they can be  much more unobtrusive and consist of brass plaques mounted in the pavements. I’ve hunted for them around the Fort Dunlop terminal but without success so far. It might make a good treasure-hunt type of mapping party! My wife just thinks I’m nuts when I get excited about coming across one of these markers on our walks representing as it does, another piece of the jigsaw puzzle. She is good enough to point out ones that I’ve missed though!

There’s also a good schematic map of where the pipelines go. Very detailed locations, which are copyrighted, can be found  at a related membership site Linesearch, which is off-limits to us OSMers and is really for on-site contractors operating digging equipment.

Birmingham is also the termination point of the Elan Valley Aqueduct, a (largely) buried pipeline bringing  water over 73 miles (118 km) from the Elan Valley reservoir in mid-Wales. Water travels at about 2 miles per hour along the pipeline taking about one and a half days to reach Birmingham at the Frankley reservoirs. It was built over 100 years ago, between 1893 and 1904 and is an engineering marvel, dropping only 52m over a length of 118 km – a gradient of 1:2300. The water arrives by gravity alone with no assistance needed from pumps. Whilst most of it is underground there are stretches of overground pipeline and there are  aqueducts bridged over rivers and the odd brick-built valve house. It was mapped with the aid of out-of-copyright Ordnance Survey maps.

Interestingly there is a large network of state-run pipelines known as GPSS (Government Pipeline and Storage System) largely for supplying military installations and is a hangover from World War II and Operation PLUTO (Pipeline Under the Ocean) prepared for supplying the D-Day landings.

As none of this gets rendered, why should anyone get excited about unseen, underground pipelines. Well, firstly there’s the intellectual satisfaction of working out what all the surface paraphernalia relates to and also of linking it altogether in a network. Secondly there’s a sense of completeness in mapping how energy, water and other industrial requirements traverse the planet. Thirdly if we’re given a tag which shows up in the editors (well it does in JOSM – I haven’t checked in Potlatch) then I suppose we’re duty-bound to use it!

Do other mappers in parts of the world, where land is not at such a premium as it is in the crowded islands of the UK and pipelines can  constructed above ground, map them? If they’re a major landmark shouldn’t they be rendered?

Perhaps the nice folks at ITOWorld will give us a rendered layer of pipelines?

Is there a way of joining the surface links of a pipeline such as reservoirs, terminals, pumping stations, venting stations, refineries, chemical works together in a relation?

Currently I indicate direction of flow with a oneway=yes tag where this can be ascertained from the  above-ground marker, which results in an error message nag from the editor and lots of little arrows rendered that are attached to nothing. So if you see one of these arrows and are wondering what on earth it can be – I’ve been mapping pipelines beneath you.
West Midlands Allotments

posted in: Participate, Use The Map | 3

After a steep learning curve with Maperitive and OpenLayers there’s a map of allotments in the West Midlands available here. It’s still rough around the edges but it forms the basis for further development (such as pop-ups with more data). I only really cracked the techniques involved when I discovered Ed Loach’s wiki page. Thanks Ed! I hope people find it useful.

The map is restricted to the West Midlands  because we wanted to work with a data set that was almost 100% complete. The data comes from web pages listing allotment sites published by the 7 local authorities in the West Midlands (Dudley,  Sandwell,  Walsall,  Wolverhampton,  Birmingham, Solihull,  Coventry).  We didn’t hit 100% as there were 14 allotment sites that either couldn’t be located or had other data quality issues. They are listed on a mappa-mercia wiki page and any help in resolving the issues listed would be welcome.  A word of praise here for Birmingham City Council who were able to answer a question about the location of a very small  3 plot redundant site which was at the back of some houses  within 2 minutes of contacting their call centre – very impressive.

It was interesting to see the diversity of how to present the information. The list of facilities available showed the most variation. Solihull was the most comprehensive : Site representative – Y/N; Car park –Y/N; Water – Y/N; Rubbish collection – Monthly from February to November; Green waste delivery – Yes at request of site representative; Security lock – Key (£10.00 deposit required). Solihull was also the only authority to have opened a new site and re-opened a semi-derelict one

Whilst editing the allotment sites, aerial imagery also showed up other sites which are privately-run and not run by a local Authority, so our map and underlying dataset shows a more accurate picture that what can be gained just from local authority listings. Even now we might not have located all the privately-owned and run sites – any help or information will be greatly appreciated.

Sadly we were not able to gather via this route the information we set out to obtain for the Allotment Data project which was waiting list data. Local Authorities do not generally hold this data:  this is maintained by each allotment site association. This will require either a concerted phone campaign or volunteered information  as and when (and if) people see value in this map.

As a result of this work, we discovered the work being done by the New Optimists Forum on food security, and inspired similar work to complete allotment data for Warwickshire. Keep going Andrew!

Mapping data on a themed basis like this opens up all kinds of interesting and linked information and also helps to make contacts and connections with owners and users of the data. Highly recommended for online community building!

Recognition at last!

posted in: Mapping Party, Participate | 0

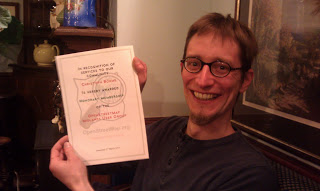
Many thanks to Christoph (OSM username Xoff) on his departure to Germany after completing his PhD. Christoph performed sterling surveying work over much of SW Birmingham and also contributed a huge technical resource in developing our website mappa-mercia.org and creating NOVAM for verifying NaPTAN bus stops. Good luck in you future career Christoph!

Whats in a Postcode?

posted in: Map Improvements, Participate | 5

Andy has been busy in B72, the heart of Sutton Coldfield, so exactly what does this mean for our map?

Short answer:
Nearly 3500 residential properties,
Almost 300 named retail units,
Nearly 100 commercial buildings,
All drawn in and with full address details including the full postcode!

Long answer:
Its taken a little over two months, a half hour here and there out walking and cycling the streets to collect all the address data; house numbers, retail names etc. Many more hours at the computer drawing each of nearly 4000 seperate buildings and in the case of residential properties their associated gardens.

This means that B72 is essentially fully mapped out. Nearly 50,000 objects in all (nodes, ways and relations). Of course we could find more to map even now but the current result is as detailed and rich a dataset/map as almost anyone should ever require.

You can browse the map here or search out an address in B72 using nominatim.

Lessons learnt:
In undertaking an exercise such as this there are always lessons to be learnt. Here’s just a few that may help and spur on others to map their areas in full detail.

  1. Tools that orthogonalise buildings (hit “Q” in JOSM or Potlatch2) are a godsend, also the duplicate and node merge (“M”) facilities when it comes to creating multiple buildings of the same shape and size.
  2. Most traditional retail units have a front facing length of 20 feet (6.1m). Very handy when dividing up long runs of shops.
  3. Postcodes were added using the OS OpenData CodePoint dataset. Postcodes are unique to a particular street (or in some cases particular address) with postcode changes along a street normally occurring at a connecting side street or other natural break (public footpath perhaps). In a handful of cases its impossible to know if a building opposite a side street is in one postcode or another and in these few instances the postcode has been left as a “?” until it can be verified.
  4. When looking at all the property boundaries you find a number of other features that are easily overlooked. Local electric substations being a good example.
  5. There is no easy way to deal with properties with vertically mixed use. For example flats over shops. A longer term solution is needed for these.
  6. Property addresses in private gated roads are difficult to obtain unless you are granted access.
  7. To show all business names in the retail heart of a town or city you really need an extra zoom level (z19) or a method of better dealing with icon and name conflicts on the rendered map.

So what’s next, well of course B72 is just one small area containing just 242 unique postcodes. Birmingham postal region alone has nearly 42,000 unique postcodes so there is a huge amount to do even for our local mapping group and without more help it will take many years. Please help by joining the project, every property and address you add to the OpenStreetMap project means more information available to West Midlands individuals, organisations and businesses.

More: Mappa-Mercia OpenStreetMap user group
Contact us: info (at) mappa-mercia.org