In order to assist a conversation on Loomio about when to hold a “Night School” mapathon, I took a look at when mappers are most involved in the quarterly project to map schools. Data is based on Harry Wood’s School Edits website.
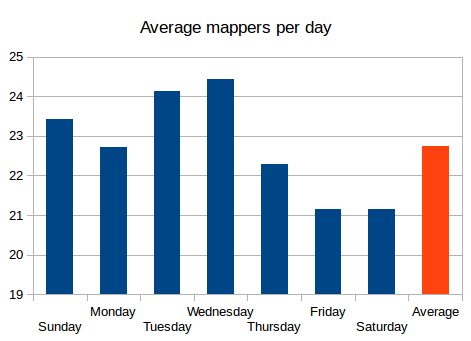
Starting with average number of mappers per day we see that Wednesday leads, whilst Friday and Saturday have the lowest number of mappers. Nothing unusual here then!
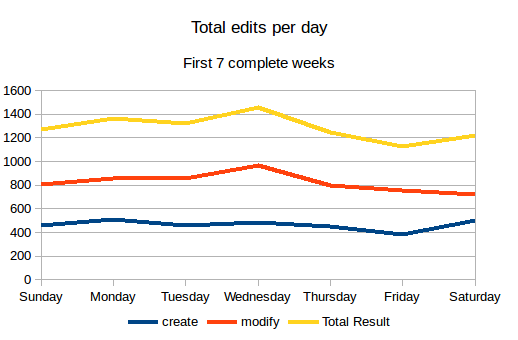
Although Monday has fewer mappers, in terms of total edits it is still up there with Tuesday and Wednesday.
If we look at the time of day we find that 19:00 is the best hour for mappers.
During the first quarter of 2016, the UK OpenStreetMap community are helping each other to map schools. If you have never mapped anything in OpenStreetMap before then here is a really simple picture guide to get you started.
Step 1: Find a school to map
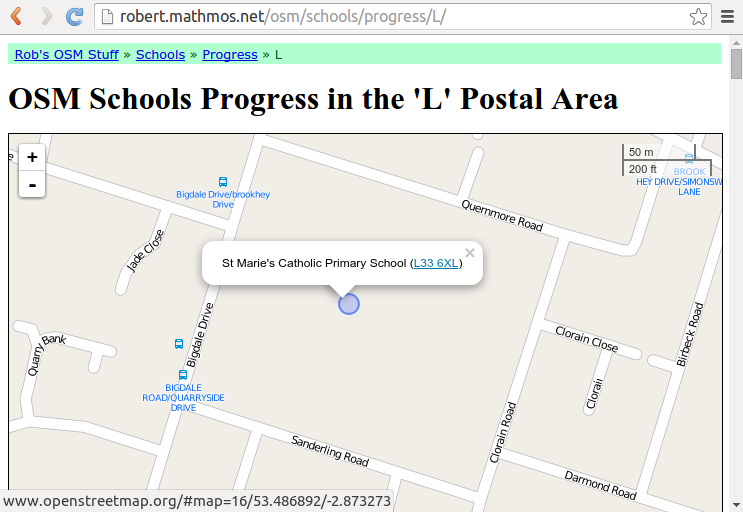
The first step is to find a missing school. Head over to the dedicated “OSM School Progress by Postcode Area” website and click on the map to pick a region. The blue circles on the map are schools from the official lists that haven’t been matched to anything already in OpenStreetMap – that is, they are missing from OpenStreetMap. Click on one and then click on the postcode in the pop-up.
Pick a school to map. The blue circles show missing schools.
Step 2: Open iD editor
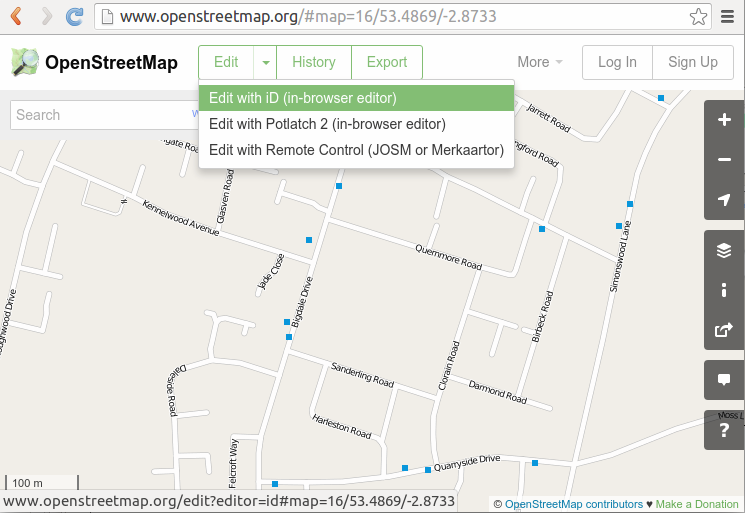
When you click on the schools postcode it will take you to the same place in the map in OpenStreetMap. To start editing the map click “Edit with iD (in-browser editor)” as shown below. If you have not already signed in to OpenStreetMap go ahead and do so, or register as a new user.
Select “Edit in iD” to get open the map editor.
Step 3: Click “Area”
The first time the iD editor opens you will be offered a walkthrough tutorial to mapping. We highly recommend you follow this. If it doesn’t appear press H to bring up the help dialogue where you can start the walkthrough.
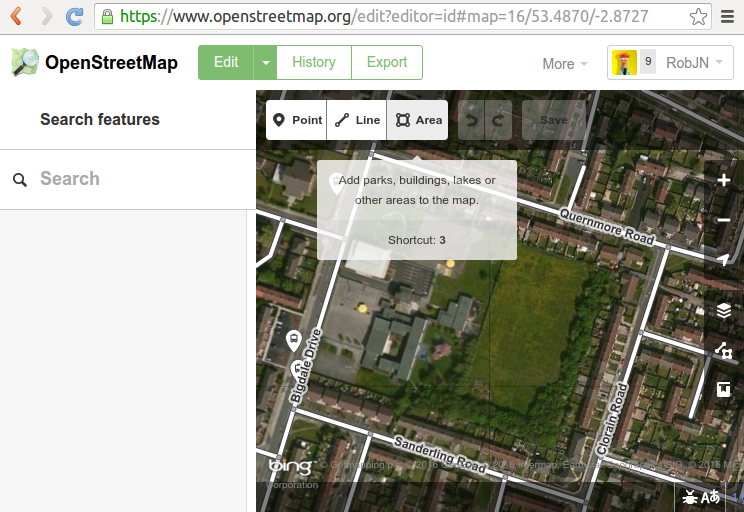
After the walkthrough zoom and move the map to the area of the school. The background imagery can be used to help you locate the school – they are usually easy to identify but if in doubt skip this school and pick another one.
Click on “Area”.
Zoom in on the school and click “Area” to start adding an area around the school boundary.
Step 4: Draw around the school
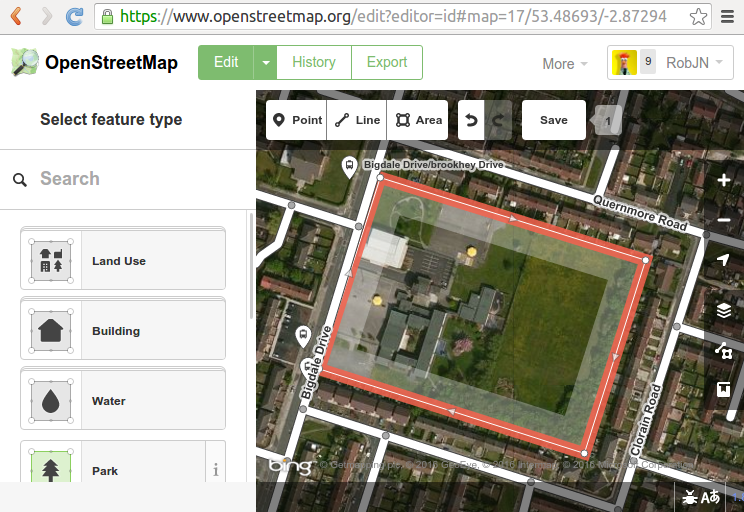
The aim here is to draw around the school boundary including any playing fields and surrounding grounds. Start by clicking in one corner of the school grounds and then continue around the school grounds clicking in each corner to form an area. Tip: If you click and hold the mouse button down you can drag the map.
When you get to the last corner, click it again to finish the area.
Draw around the school grounds, clicking the last point twice to finish tracing the area.
Step 5: Mark the area as a School Grounds
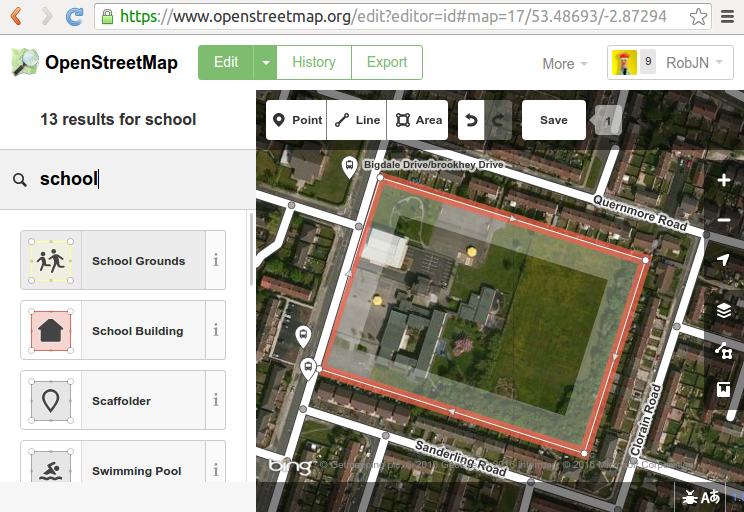
With the area traced we now need to tell the iD editor that this is a school grounds. Under “select feature type” click in the search box and type “school”. Click on the School Grounds option in the list below.
Select “School Grounds” as the feature type.
Step 6: Add the school name
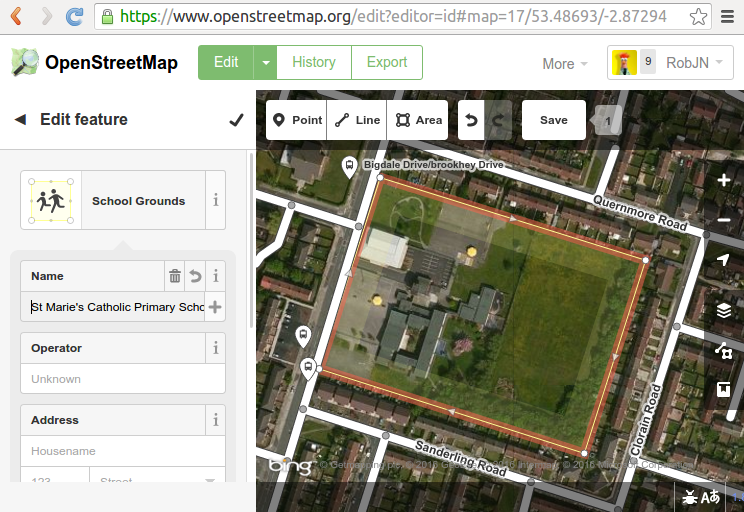
In the school grounds detail box add the schools name and any other info you may have, for example the address.
Add the school name.
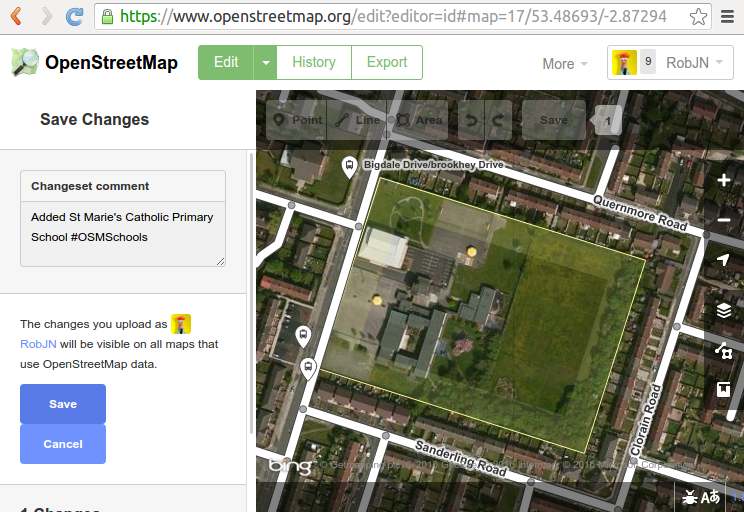
Step 7: Save with a comment
Finally select “Save”. Add a comment in the dialogue box and press Save. Here I have type “Added St Marie’s Catholic Primary School #OSMSchools”. The #OSMSchools enables us to see how many people are contributing to the quarterly project to map schools.
Save your edit with a comment.
Congratulations! You have added a school to OpenStreetMap. How easy was that!
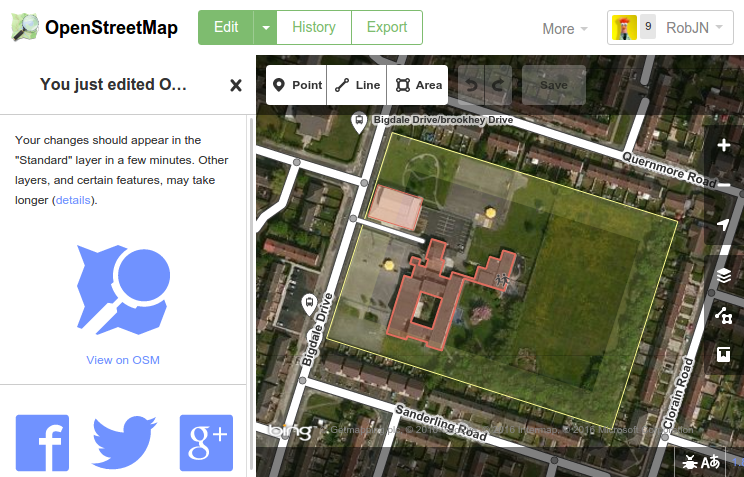
Optional extras: Add more details
You may want to add more detail to the map such as the school buildings, playing fields, and so on. Here I have followed a very similar set of steps as above to add the school buildings and a service road.
If you get stuck and need any help feel free to contact us. We’re happy to help out!
Optionally add more detail following similar steps as above.
We have many ways to follow the progress of the fifth quarterly project – schools. One such method is to look at the changesets that include the comment “‘#OSMSchools”. We can visualise these as a map, or in this case by a simple total of the changesets completed per user.
As the list has now grown to over 40 people, I am posting it here rather than on the wiki. There are of course other ways to see who is involved, including the school edit tracker provided by Harry. This counts edits to features tagged “amenity=school” therefore getting round the problem of needing to include #OSMSchools in the changeset comment. Where a changeset can include any number of school edits, Harry’s tool counts each on individually.
Please continue to use #OSMSchools in your changeset comments. I will update the wiki to link to this post and to retain user comments (e.g. where you are mapping, how you are helping).
It’s been a month since we started our fifth quarterly project, so let’s look at where the engaged OpenStreetMap contributors are editing. Read on to find out where the mapping hot-spots are and where we have missing map locations.
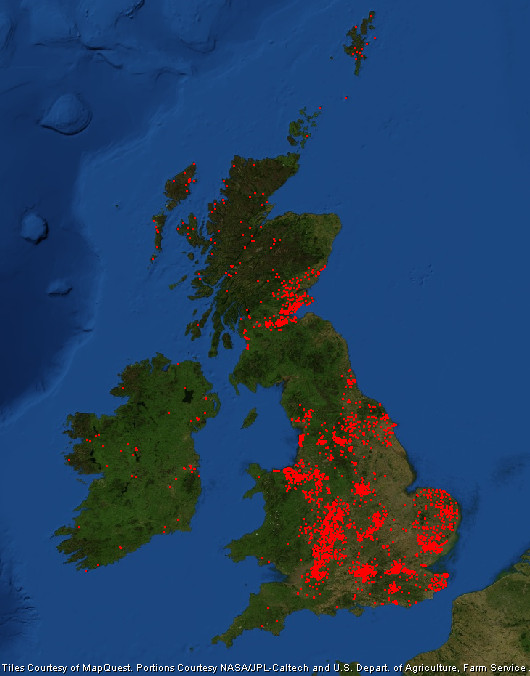
Each quarter year we pick a different task to work on. The fifth is all about schools and has (by a long way) been our most successful. Let’s therefore use it to get an idea of where the engaged OpenStreetMap community is. By “engaged” I mean, where are the UK OpenStreetMappers who follow the community channels – such as the talk-gb mailing list and twitter accounts like ours – and join in with group mapping efforts.
Map of the OpenStreetMap community engaged in the quarterly project to map schools.
As you’d expect most edits are focused on large towns and cities. Here we have a larger population from which to attract engaged mappers, and of course there are more schools to map without having to travel so far. Large cities don’t always equate to lots of mappers though. Manchester and Liverpool are lagging behind; a trait we also saw during our first quarterly project (note: edits in the OL postcode region are my remote edits).
The cities that are most engaged also tend to be those with OpenStreetMap communities that meet regularly.
Perhaps big urban areas seem to daunting to an individual mapper! What we see is that the cities and larger towns that are most engaged also tend to be those with OpenStreetMap communities that meet in person regularly. These include Birmingham (this group), London, Nottingham and the central belt of Scotland. Perhaps the active mappers in Blackpool and Bradford could see if there is any interest in setting up a local community focused along the Mersey!
Other areas that are doing well are Cheshire, East Anglia, the South East and along the River Severn. Within the more rural areas Yorkshire is doing well (mapping is across the county not just in the larger urban areas) and as previously noted the Outer Hebrides and Shetland Islands.
Cardiff is another example of a city that is missing mappers. As are most of Wales and the South West, much of which is rural. They are joined by the region sandwiched between the Lake District and Edinburgh.
Finally, Ireland’s mappers are focused on mapping Townlands, but nevertheless they’ve found time to map a few schools in both Northern Ireland and the Republic of Ireland.
Progress on our fifth OpenStreetMap quarterly project – schools – continues to delight. Today we congratulate the HS (Outer Hebrides) and ZE (Shetland Islands) postcodes for becoming the first to reach 100% completeness!
Not even a month in to the latest UK Quarterly Projects and there has already been so much to celebrate. Here are the highlights from the third update on our project to map Schools.
1. HS and ZE are 100% complete!
Yes you read it right! Mapping of schools in the HS (Outer Hebrides) and ZE (Shetland Islands) postcodes are complete thanks to the efforts of OpenStreetMapper seumas. This means that all schools are mapped as a land area at minimum. We continue to add detail (e.g. buildings, sports pitches and paths) to further improve the mapping of the schools. Many other postcodes (most with more schools within them 😉 ) are close to 100% complete now too. Follow the progress here.
Sir E Scott School on Tarbert in the Outer Hebrides. Image courtesy of Urban Realm.
2. Open Data Manchester
Following a tweet Open Data Manchester have asked whether anyone can go and show them how to map. Looks like their next meeting is Monday February 1st, 6.30 – 8.30pm. Any volunteers?
3. 175 people have done 5351 edits
Amazing numbers measured by Harry’s tracker. Looks like Uganda has joined the project too. It would be great if someone could turn the CSV linked data at the bottom of the tracker into a daily chart. Drop us a comment below if you are able to help.
4. Nodes converted to ways
Following lot’s of data clean up we are nearing 80% of schools mapped as land areas rather than simple points. We should hit this in the next couple of days.
5. Northern Ireland still needs some work
If you map in Northern Ireland and want to get involved please do. Each extra school mapped there will help lift it off the bottom of the tracker. We can also look at doing some initiatives in NI if the local community want this. Let us know 🙂
Interested in mapping schools in your area? To join us see here. Never mapped before? No worries, contact us for a helping hand.
January 1st marked the beginning of our fifth OpenStreetMap quarterly project – schools. After 18 days we return back to square one. So what’s been going on?
The UK Quarterly Projects are intended as a bit of fun designed to inspire a few edits to OpenStreetMap in peoples spare time. Hopefully they also help with the sense of community and attract a few new people to OpenStreetMap. Our fifth project is all about schools.
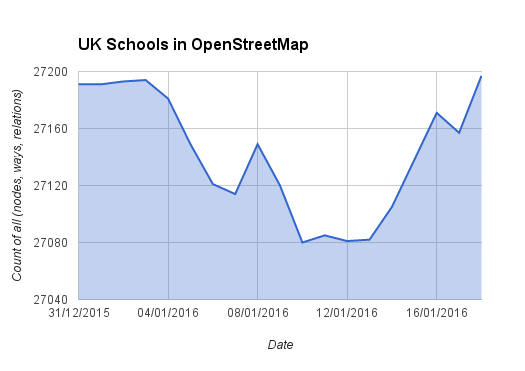
One of the methods we use to track progress is a daily count of the total number of schools mapped in OpenStreetMap. This is based on the data reported by TagInfo and the data is collected daily thanks to a script written by Adam Hoyle.
UK schools mapped in OpenStreetMap – back to square one?
Normally we would expect to see the graph trend upwards, but with the schools project we started with an initial dip, having only just returned to square one. Why?
Well all is not bad. The chart above hides a lot of progress that has been made. Thanks to early work by Frederik and a uMap produced by Jerry, there has been a big focus on improving the mapping of existing schools. In many cases this meant converting a simple node (point marking the centre of the school) to a way (polygon) demarking the boundary of the school. The chart unfortunately misses these! There were also many cases where a school had been marked with both a node and a way. This is considered bad practice and the drop in the chart reflects how people have been cleaning this up.
We see that a hugely impressive 137 people have been helping to map schools in OpenStreetMap, editing a total of 3,300 schools!
So what progress has been made? To answer this we can refer to a number of new progress trackers. Firstly Harry Wood‘s school edit tracker. This counts the number of UK school edits that have been made. We see that a hugely impressive 137 people have been helping to map schools in OpenStreetMap, editing a total of 3,300 schools! For fun Harry’s tool also provides a leader board – congratulations to Robert W, Paul (southglos) and Mark S for taking 1st, 2nd and 3rd respectively.
We can also track progress by postcode region thanks to Robert W’s comparison tool. In my previous post we looked at how the KY postcode area was leading the way. Overall we have now increased the number of schools mapped in OpenStreetMap from 62% to 68% (excludes Northern Ireland data as this was added later). If we continue at this rate we will reach a massive 90% by the end of the quarter. I think we can get closer to 100% as the pace will pick up now that the initial clean up of existing data is coming to an end. 🙂
Up for the challenge? To join us in adding schools to OpenStreetMap see here. Never mapped before? No worries, contact us for a helping hand.
It has been amazing to see the level of activity for the fifth OpenStreetMap UK quarterly project – schools. So far nearly 300 schools have been mapped or improved by 22 people. The Kirkcaldy postal area – KY – leads the way with over 30 schools mapped.
At just 10 days in, the community of mappers have:
created a number of amazing tools to help identify missing or incorrectly mapped schools;
agreed on new tags to allow us to reference the English Edubase and Scottish Executive Education Department data; and
made massive progress on mapping.
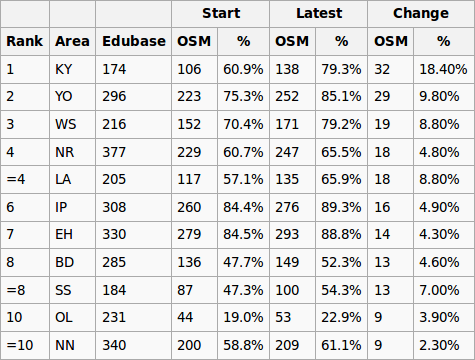
So which area is leading the rest? Based on Robert W’s comparison tool, here are the top 10 most improved postal areas. This is measured by the increase in OpenStreetMap objects that “match” the government data between 2016-01-05 and 2016-01-10. Other measures are of course possible and may show a different picture.
KY leads the way in our list of top 10 most improved regions.
Well done to the Kirkcaldy postcode area, KY, for heading up our leadership board. Great work!
There is still plenty of time to get involved with adding schools to OpenStreetMap, the worlds largest crowd-sourced and most up to date map. A list of useful resources can be found here. Not sure how to map? No worries. Check out our tutorials, get in contact with us, or if you are in the West Midlands why not pop along to our next social and find out how.
At the end of October Telenav released a tool to help identify incorrectly tagged, or missing, one way streets in OpenStreetMap. The tool makes use of the data they collect through their Scout Navigation app and compares this against OpenStreetMap data. If the scout data shows that drivers only travel in one direction down a street it the tool checks for a corresponding oneway=yes tag in OpenStreetMap. If it doesn’t find it then it flags up a potential error.
The potential errors can be viewed at the Improve OSM website, but the best way to use it is with the “trafficFlowDirection” plugin for the JOSM map editor:
Download the “trafficFlowDirection” plugin for JOSM.
After restarting JOSM add the Bing background via the Imagery menu. The Traffic Flow Direction layer should add itself to the list of visible layers automatically.
Zoom to a potential oneway error as identified by the orange circles (when zoomed out) and the orange arrows (when zoomed in).
Download and fix the OpenStreetMap data if appropriate.
So others know the error has been fixed (or marked as invalid if appropriate) mark the issue as Closed (or Invalid). Do this by first making the TrafficFlowDirection layer active and selecting the issue you just solved:
Then click the green lock in the plugin panel, add a comment, and close the issue.
Don’t forget to upload the improved OpenStreetMap data when you have finished.
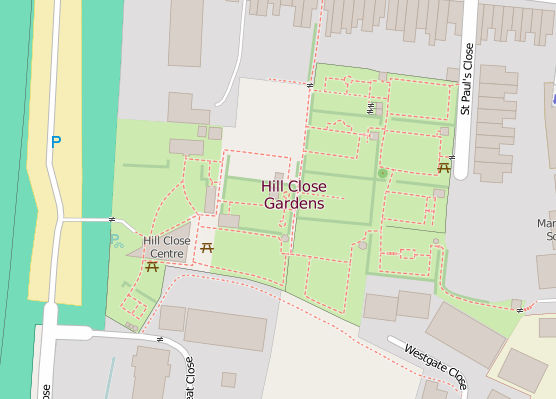
It wasn’t just Hadrian’s Wall that I mapped in OpenStreetMap as part of our third UK quarterly project – “all things tourism”. Closer to home I visited and mapped the wonderful Hill Close Gardens in Warwick. The gardens are a “very rare example of detached Victorian leisure gardens which were found on the outskirts of many towns in Victorian times”. They comprise 16 individual plots, numerous summer houses and the larger visitor centre building. It was therefore no small task to add this to OpenStreetMap – in fact I still have a couple of plots left to map as I ran out of time on the day I visited the gardens!
Map of Hill Close Gardens, Warwick
In addition to my visit to the gardens (and the numerous photos I took), I made use of the Warwickshire County Council aerial imagery to help add in all the detail and paths. As a reminder to other OpenStreetMappers this aerial imagery is free to use to assist with your mapping efforts. It was fascinating to see how the area had changed over the years thanks to historical maps – this time from Warwickshire County Council’s mapping portal, although I’m sure there are some great maps on the National Library of Scotland’s site too.
Next steps are to finish off the last two plots in the north section of the garden. The gardens also provide lots of information about the history of each plot. It may be good to add this to the gardens’ entry on wikipedia. And of course, I need to add the wikipedia article details to OpenStreetMap so that we continue to build links between these two crowd-sourced projects.
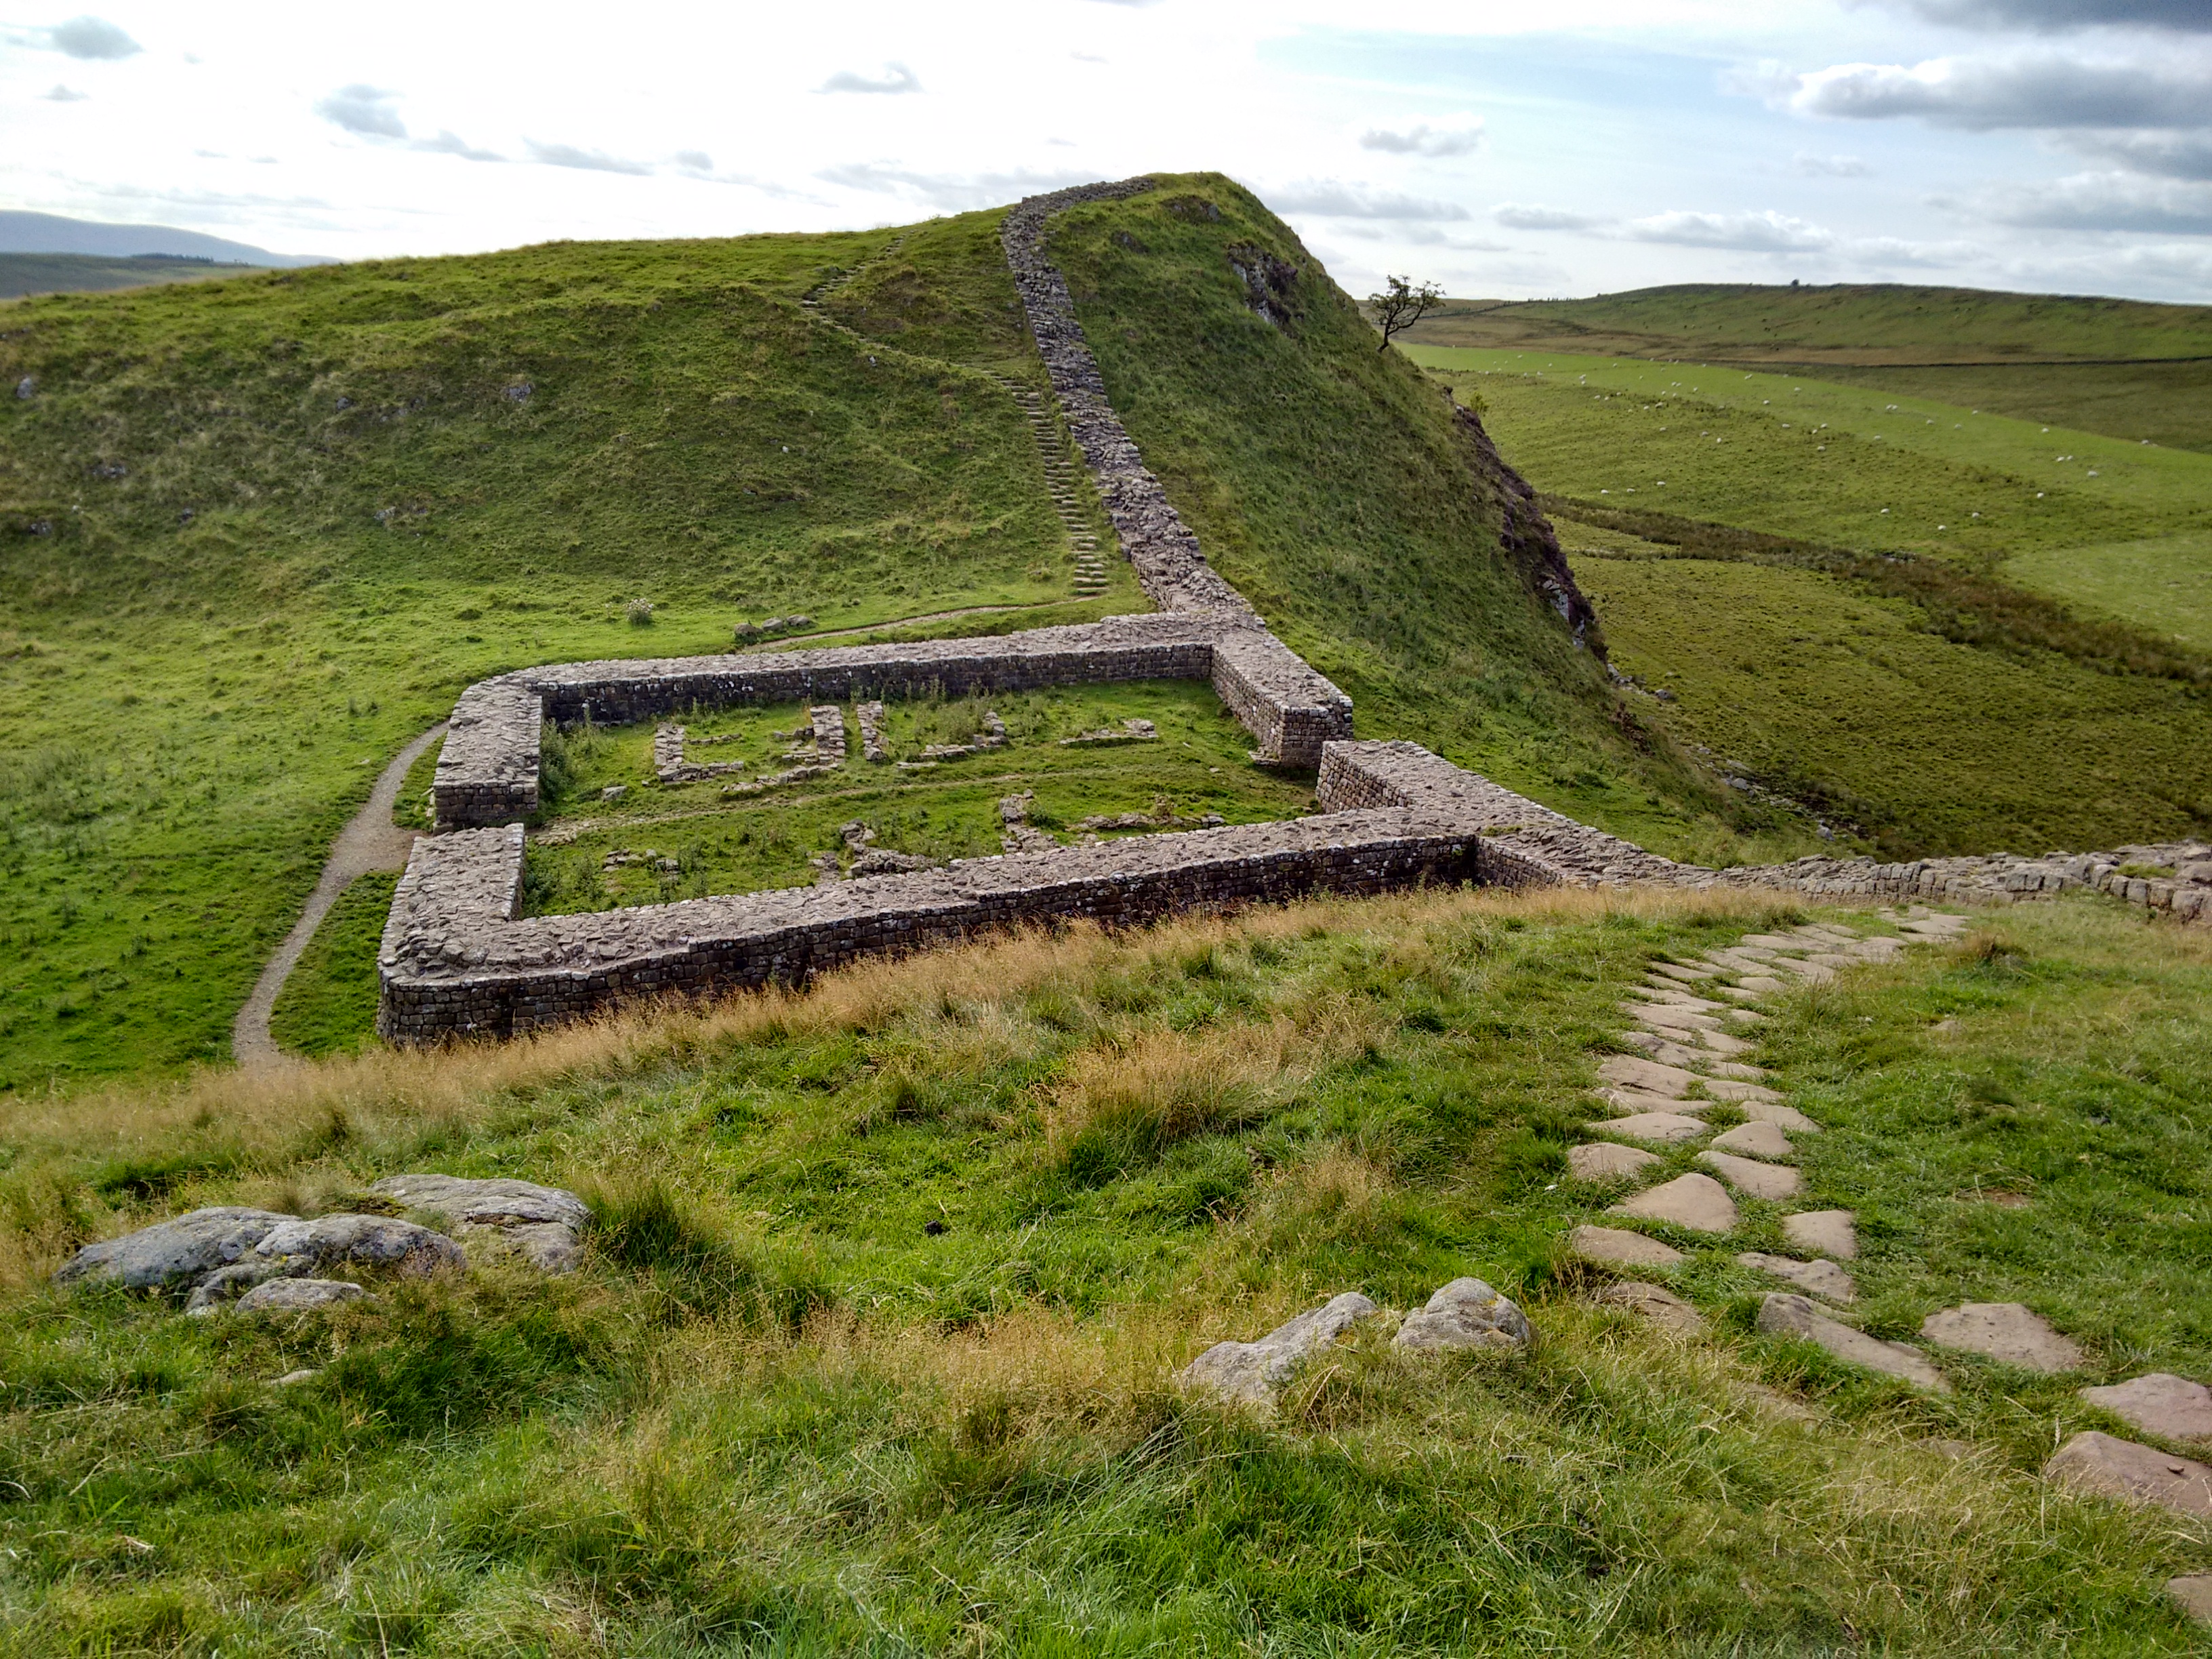
Our third quarterly project for UK OpenStreetMappers saw us focus on all things tourism. A walking holiday along Hadrian’s Wall gave me a great opportunity to map one of the UK’s oldest, and definitely longest, tourist spots. Of course it was in no way a tourist site when it was first built in AD122, but just as maps have changed function from a military tool to an aid for tourists, so has Hadrian’s Wall.
A milecastle on Hadrian’s Wall
Along with other borders of the Roman Empire, Hadrian’s Wall is a World Heritage Site. Given this, and the prominence of site on the landscape, I was surprised to find that it wasn’t well mapped. The fortification comprises, from north to south, a ditch/cliff edge, the wall, the old military road, and finally another series of ditches know as the Vallum (to keep ordinary folk in the south out of the military zone). In places the Vallum had been mapped as the wall and big swaths of the wall were missing from OpenStreetMap.
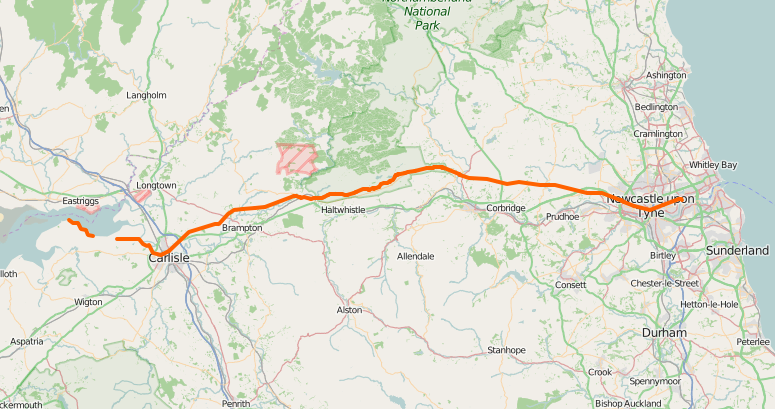
Using my collection of photos, GPS traces, and the wonderful historical maps provided by the National Library of Scotland, it didn’t take long to improve the representation of the wall within OpenStreetMap. Now the wall (or wall-route where little of the original wall remains) is correctly mapped and gathered in a relation. The mapping of the vallum is also much improved.
The wall in OpenStreetMap. The gap in the west is Burgh Marsh – was the wall built here?
There is however still plenty to do, including mapping other parts of the world heritage site such as the milecastles and the turrets that were built along the wall. A full record of what is included as part of the world heritage site is available on the UNESCO website, with mapped features added to an parent relation in OpenStreetMap.