Many of you will have already heard the great news, but for those who haven’t, I am pleased to announce that OpenStreetMap’s annual conference will be held in Birmingham, from 6th – 8th September 2013.
The conference, known as State of the Map 2013 (SotM 2013), will see 300 users converge on Birmingham to discuss everything OpenStreetMap. It’s been 6 years since the conference was last held in the UK and in that time OpenStreetMap has developed from a project with 10,000 contributors, to one of 1.05 million registered users. To reflect on this huge growth, this years theme is “Change”.
Simon Poole, Chairman of the OpenStreetMap Foundation reflects:
“Change is a constant in OpenStreetMap. Not only does the world around us change and require resurveying all the time, the OpenStreetMap project itself continues to evolve very rapidly in every aspect. The organisation that is returning to the UK with its main public event after 6 years, has grown from a small, fun project, to an undertaking that is competing with multi-billion dollar corporations but still is fun for everybody involved. In that vein I’m looking forward to SOTM in Birmingham and expect that we will all have a great and interesting time.”
Being such a big event, we are delighted that we are not alone in organising the conference. In addition to regular Mappa Mercia members, we also have the support of many other OSMers from both inside the UK and around the world. Thank-you for all your input.
In my December and January blog posts about Maperitive, I discussed how to download OpenStreetMap data. The first method used the “export” feature on the osm.org homepage to download all data within a geographic area, whilst in my second post we used the Overpass XAPI Compatibility Layer to download just those ways (polylines) tagged as gritting routes.
In this post we will explore how to find out more about OpenStreetMap tags and how we can visualise the data online.
OpenSteeetMap Wiki
The OpenStreetMap Wiki is the main documentation portal for OSM. The Map Features page provides an initial list of tags, with links to detailed pages about man tag keys and values (recall that all tags are in the format key=value). For example the tag “highway=footway” has a wiki page all about the key “highway” (see Key:highway), in addition to a page specifically about the “footway” value (see Tag:highway=footway).
Note that the wiki should be considered as a guide only. Not all tags are documented and some tags are marked as “proposals” only. Use the search bar in the top right to help discover related pages.
TagInfo
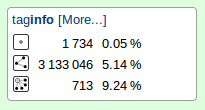
On both Key and Tag wiki pages, you will often find a box on the right hand side which includes a subsection titled “TagInfo”. This provides stats about how many nodes (points), ways (polylines) and relations (multipolygons) are tagged with that key/tag.
TagInfo stats on the highway=footway wiki page.
TagInfo is a separate website that reports on how tags are actually being used in OSM. By examining the raw data it provides stats about all tags used, not just those with documentation. It also provides information about common tag combinations. So for example we can see here that the the “highway=footway” tag is often combined with tags about the surface and bicycle use. We can also see a static global map of where the highway key is used (see here).
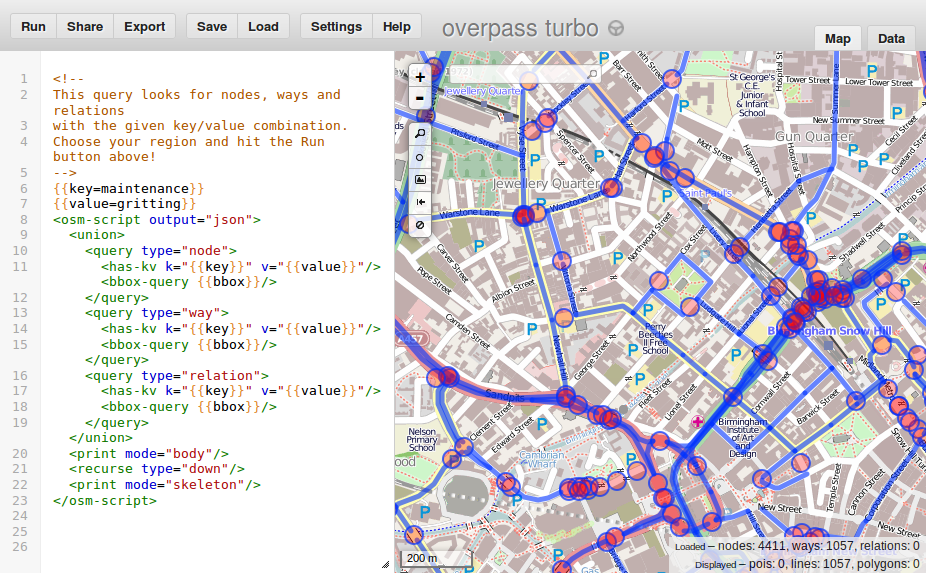
Overpass Turbo
Overpass Turbo is a web based interface for the Overpass API download servers. With turbo you can run any kind of Overpass query and display the results an interactive map. As such it provides greater visualisation of the data than TagInfo’s basic static map. Be warned however that this should be used for small quantities of data only (that is, infrequently used tags, or if using common tags the interactive map should be well zoomed in). It is also not as simple to use as TagInfo, however each TagInfo page includes a link to turbo (a button with a steering wheel on it) that will pre-populate turbo with the correct query. You just need to zoom in and click “Run”.
Overpass Turbo query showing gritting routes in Birmingham
Once you have investigated the OpenStreetMap data you can move on to download it using the Overpass XAPI Compatibility Layer or use the Overpass API queries as shown in the example above.
Boundaries, be they land ownership or administrative boundaries, form an essential part of geo-data. Was it therefore a success for the open data campaign when Ordnance Survey released the Boundary-Line product, containing all electoral and administrative boundaries, under the OS OpenData Licence? Not Quite.
The problem is that boundary is the “Boundary-Line” data are not boundaries! There are two issues, and these apply to all geospatial data released as independent vector layers; scale and context.
Scale
Large scale maps (such as walking maps), have a higher resolution than medium, or small scale maps (such as country of global maps). The larger the scale, the higher the resolution and therefore the more detail shown. As boundaries twist and turn following streams, rivers and hedges, it is important to use a large scale/high resolution. The Ordnance Survey provide boundary data in two products; the free “Boundary-Line” product, and the non-free “OS MasrterMap” product. According to Ordnance Surveys own admission:
Boundary-Line is captured against a lower resolution mapping backdrop and the boundaries are captured to represent the data at a nominal 1:10000 viewing scale. The process of generalising the data may have caused some features to be moved from their true ground position for the purpose of map clarity.
So scale, or to give it it’s proper name, generalisation, is the first problem we should be aware of before using Boundary-Line data in OpenStreetMap.
Context
Lets see what Ordance Survey have to say about their other boundary product – OS MasterMap:
OSMM Topography Layer currently holds the definitive and more accurate boundary information as the boundaries are mered (aligned to) real-world features on the ground. Captured at mapping scales of 1:1250, 1:2500 (for urban areas) and 1:10k (for rural).
Okay, we can see that MasterMap uses a larger scale / higher resolution which helps provide more accurate data, but what is that reference to “mereing” (alignment). Mereing, is the process of establishing a boundary relative to ground features present at the time of a survey (source: ESRI). As such any boundary line extracted from a map of any resolution cannot therefore be used on its own to describe a boundary – once you extract the boundary, you loose the context provided by the rest of the map! Lets look at an example.
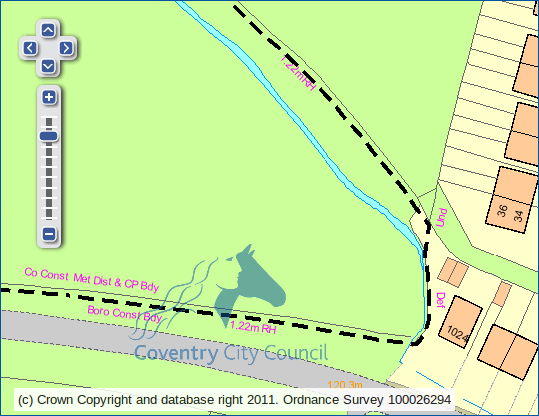
For illustration purposes only (courtesy of Ordnance Survey and Coventry City Council).
In the example above we see the boundary as a black dashed line. Along the line are some descriptions in pink. The first couple are relatively easy to decipher – “Co Const Met Dist & CP Bdy” is shorthand for County Constituency, Metropolitan District and Civil Parish boundary. Similarly “Boro Const Bdy” tells us it is a Borough Constituency boundary. As we follow the boundary we reach more abstract shorthand:
1.22m RH – RH stands for Root of Hedge, and 1.22m equates to exactly 4ft. The boundary is therefore 4ft away from the stem line of the hedge. This unusual convention comes from the presumption that landowners planted hedgerows slightly in from the edge of their land so as to not encroach on their neighbours plots. The distance differs between 3ft and 5ft depending on which parish the land lies within.
Def – This is a “defaced boundary”, meaning that the original feature that the boundary was aligned to no longer exists. This was probably a hedge that was removed when the houses were built. Had the hedge roots not been removed then the boundary would be marked as “Tk H” implying track of hedge.
Und – An “undefined boundary” is one where there was no real-world feature to align the boundary to when it was surveyed.
Any vector extract of boundary data will be problematic due to generalisation (scale) and the loss of information about mereing (loss of context). If you are really keen on determining the exact boundary you may want to read more about boundary presumptions or go and dig out the original surveyors notes (Perambulation Cards) at the National Archives.
Discussion
So for OpenStreetMap should we be linking boundary ways to streams and hedges on the acknowledgement that Boundary-Line data is not perfect and we are not able to provide any certainty as to which side of the hedge the boundary actually resides on? Please leave your thoughts as comments below.
In my previous post entitled “Maperitive: My first map render”, I introduced the concept of creating your own map style using the offline tool, “Maperitive”. At the time we looked at a very simple example of downloading a geographical region of OpenStreetMap data, loading it into Maperitive and drawing (rendering) your own map using the built in rendering rules.
In this follow up post we will explore the idea of creating your own basic rendering rules in order to highlight specific map features. As coincidence will have it, at Mappa Mercia’s last monthly meet-up we spoke about rebooting the main mappa-mercia.org website no that our original maintainer is no longer living in the UK. I will therefore look at the gritting map as an example.
Step 1. Downloading the data
Before we can get started on writing the rendering rules we must first download the required OpenStreetMap data and understand the tags – after all it is the tags that drive the rendering rules!
To do this we are going to use the Overpass XAPI. This enables us to download a subset of data based on a specified tag and geographical region (defined by a rectangular “bounding box”). In this example we will download all ways with the tag “maintenance=gritting” that fall within a sample are of Birmingham. Copy and paste the following web address into your browsers URL box and save the resulting file as “gritting.osm”:
As you can see, the web address used to download the required data is easy to understand and adapt to other uses. The geographical region is specified by “[bbox=-1.93,…] ” and the download is restricted to only ways with the tag “[maintenance=gritting]”. Finally [@meta] is used to download the additional metadata required to open the file in JOSM.
For more examples, see the wiki entry for Overpass XAPI. Other ways to download OpenStreetMap data can be found here.
Step 2. Examining the data
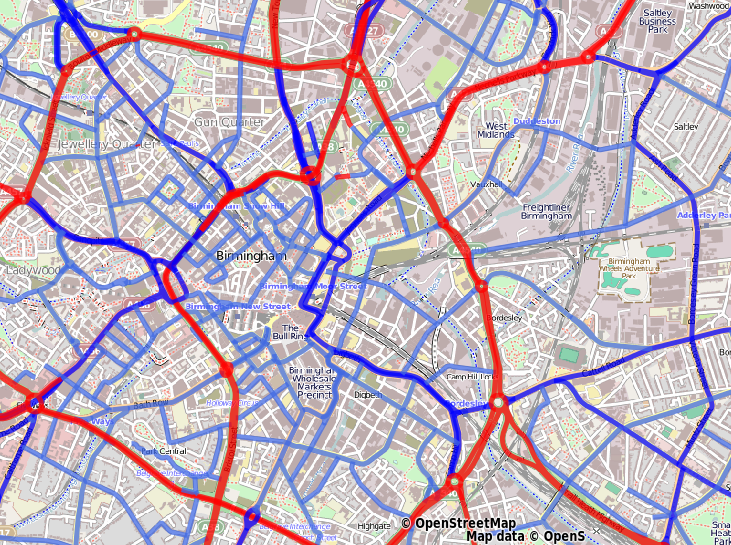
If we open the resulting “gritting.osm” file in JOSM (or if you already know the data well enough), we find that all gritting routes are tagged with a priority from 1 to 3. For example, “gritting=priority_1”. We will therefore set up our rendering rules in order to create map showing these as colour coded routes.
The output map as rendered by Maperitive.
Step 3. Writing the rendering rules
Maperitive rendering rules specify what gets drawn on the map and how it gets drawn. You start writing rules by specifying “features”. A feature could be a forest, a motorway, a bench. This answers the “what?” part. After that, you specify the actual “rules” for these features. This answers the “how?” part.
Rules are specified in a simple text file and can be edited with a text editor. Within the “Rules” folder of your Maperitive installation, create a text file called “gritting.mrules” (note that in Windows you may have to change a setting so that file extensions are visible) and copy the following text into the file:
features
    lines
        gritted route : maintenance=gritting

rules
    target: gritted route
        define
            line-opacity : 0.75
            min-zoom : 5
            line-width : 5
        for : gritting=priority_2
            define
                line-color : blue
        elsefor : gritting=priority_3
            define
                line-color : royalblue
        else
            define
                line-color : red
        draw : line
In the top section, we are defining that we wish to create a line feature called “gritted route” and that only ways tagged as “maintenance=gritting” belong to this group. In the lower section we define rendering rules for the feature. All gritted routes are drawn with the same line opacity, minimum zoom and line width, however we separate out line colour according to the priority tag. In my test, it would appear that any HTML colour name is allowed (?). For more on rendering rules, see the Maperitive guide.
Step 4. Create your map
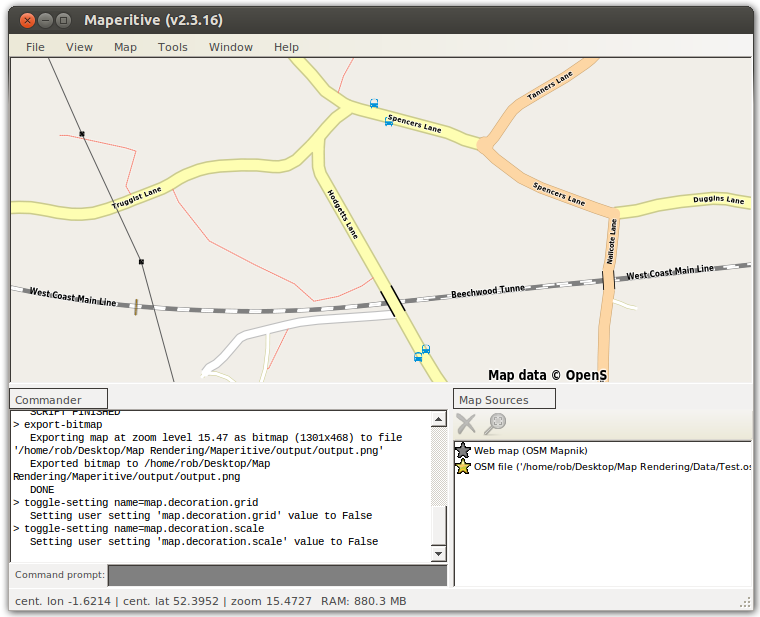
We’ve downloaded the OpenStreetMap data and written some basic rendering rules. All that remains is to generate our map. Open Maperitive and load the “gritting.osm” file using File->Open Map Sources…. The final step is to tell Maperitive which rendering rules to use. To do this enter the following two lines (one at a time) in Maperitive’s Command Prompt:
Finally we can export the map as a PNG image by using Tools->Export To Bitmap. The location in which the image file was saved is shown at the bottom left, as the final line in the Commander
When I introduce someone new to OpenStreetMap I often get asked how is it different from alternatives, such as Google Maps. One of the key differences is that our map data is supplied and incorporated by 1000s of volunteers, each one passionate about their local community or area of expertise. This means that our data is often rich in local knowledge, and is also frequently updated (as seen in speed by which the Humanitarian OpenStreetMap Team respond to changes caused natural disasters).
All this map data is fantastic, but if you cannot present it in the way you require, then you might as well not have it in the first place. This leads me to a second difference between OSM and other alternatives; namely all the underlying data is available to download and use for free. If you are not happy with the way the map looks, then you can you can use the data to create your own map. In this blog post, I introduce one such tool – Maperitive.
Question: What is Maperitive?
“Maperitive is a desktop application that renders maps in real time using OSM and other sources of data.” In essence we provide Maperitive with raw map data and a set of instructions describing how we would like the data to be displayed, and it draws (or renders) us a map.
Question: How to download and install?
There is no installation process as such. Simply download the latest version of the Maperitive zip file from http://maperitive.net/download/, unzip it into a directory of your choosing, and run it by double-click on maperitive.exe. (For non-Windows OS’s installation instructions can be found here).
Question: I’ve downloaded and opened Maperitive, what am I looking at?
The user interface for Maperitive comprises of 4 parts. The majority of the window is taken up by the Map Area. By default this will be showing the standard OSM Map, or “Web Map” as can be seen in the Map Sources list in the bottom right hand corner. As we add more data this will appear in this list. The map can be moved by clicking and dragging, and zoomed by pressing the + and – keyboard keys (or using a mouse scroll-wheel).
At the top is the Menu Bar with drop down menus (File, View, etc..). Finally, in the bottom left is the Commander. Here we can enter instructions in the command prompt, however to keep things simple, we will only be using the Menu Bar to issue instructions in this blog post.
Question: How do I render my own map?
Before we can render a map, we must first get some map data. There are many ways to get OpenStreetMap data (we will explore these in a later blog post), including through Maperitive itself. For now we will use the OpenStreetMap.org website. Load the website and move to an area you are interested in. To download the data simply click “Export” and select “OpenStreetMap XML Data” as the download format.
Once you have downloaded some OSM data lets get Maperitive to render it. Start by clicking the star next to “Web Map” in the Map Sources list. This switches off the default map and the Map Areashould become a blank canvas ready for us to render a map. To do this open the downloaded map data using File->Open Map Sources…. Congratulations you have rendered your first map! By default the map will look very similar to the standard OSM map. We can however change this by selecting a different set of “rendering rules”. Try the different rules by selecting them using Map->Switch To Rules.
In a following blog post we will explore how to create your own rendering rules, and therefore customise your map to your liking. But for now lets finish by exporting the map to a PNG image. Choose Tools->Export To Bitmap. The location in which the image file was saved is shown at the bottom left, as the final line in the Commander.