Mysterious Objects: no 7 in an occasional series

posted in: Observations | 2

It’s been a long time since I’ve found an object on my surveys that has left me perplexed. Neary two years actually. The cynical side of me thinks its probably I haven’t been curious enough or motivated enough to document it. And to my embarrassment, it’s on my daily walk to the shops.

Anyway, can anyone help with this one? It’s about 3 inches square and embedded in a pavement and doesn’t look like it’s  a lid that can be opened to something like a valve or switch. Also it looks like it’s brass which is unusual for street furniture of this kind.

There’s no map to look at in this blog- it’s secret!

posted in: Observations | 4

The attempts at secrecy surrounding the UK’s water supply became even more bizarre following my previous blog concerning the location of fire hydrants in the West Midlands, where making a map of fire hydrants is considered a threat to national security.

Now we have the local water utility company, Severn Trent Water, joining the West Midlands Fire Service in attempting to prevent mapping of water resources, using similar “national security ” concerns, although the phrase used by STW is “national critical infrastructure”.

As part of the current OSM UK quarterly project which is to improve mapping of any water features I thought it would be great to map the installation of the new pipeline paralleling the existing Elan Valley Aqueduct which is imaginatively named the “Birmingham Resilience Project”.

BRP is a massive  £242m  two-year civil engineering project and is designed to  provide resilience to the Edwardian aqueduct opened in 1904 which supplies Birmingham all the way from a reservoir in the Elan Valley in Wales.  This pinnacle of Edwardian engineering is  a 73 mile (117 Km) supply which requires no pumps, relying on gravity and siphons.

The Birmingham Resilience Project will provide a parallel supply for the last section of the aqueduct. It will run 16 miles (25 Km) from the River Severn at Stourport to the Frankley Reservoir to the West of Birmingham. It will be  a pumped underground pipeline. The best short online description of the project is here. There’s also an in depth presentation here  by the Head of Pipelines from the main contractor Jacobs

STW’s informative online pages about the project include a FAQ  where you can apply to look at the map of the proposed route(!)

Originally STW had published an online map showing the proposed route overlaid on an OpenData map from the Ordnance Survey (the UK’s national mapping agency). This would have made mapping it for OSM a doddle. However there was a statement on this map:
“This drawing is not to be used in whole or part other than for the intended purpose and project as defined on this drawing.  Refer to the contract for full terms and conditions.”

So I contacted STW to see if we could use the map as I couldn’t refer to the contract which isn’t a public document. (Remember all  UK public utilities, except the National Health Service and the BBC, and large swathes of central and local government are run privately with no accountability or information other than to contracted parties or shareholders.)

What transpired was a phone conversation which was quite stunning in its convoluted reasoning. I didn’t record it, but it was along the lines of:

“Yes we’ve published a map based on opendata but no you can’t use it”

“Why publish it, if we’re not allowed to use it?”

“We need to undertake public consultation, but the data can only be viewed not replicated as it concerns national critical infrastructure”

“So if I walk along public footpaths and roads and take photographs and gps readings wherever I can see this 16 mile civil engineering project and then make a map from my collected data, that woud be OK?

“Yes I guess so”

“So why not save me the effort and give me the data, which has already been made public, as the effect will be the same: publishing a map of a highly visible civil engineering project?”

“We can’t do that – it would compromise national critical infrastructure”

Repeat the last two statements ad infinitum.

Despite its absence from STW’s website and the medieval process of applying to look at it (and no doubt have your name recorded as a potential threat to national critical infrastructure); for those of you who want to see  a map of the proposed route, the online planning sites of each local authority that the new aqueduct traverses (Wyre Forest District Council, Wychavon District Council, Bromsgrove District Council, Birmingham City Council) provide dozens of very detailed maps, all of which are copyrighted however. So it doesn’t get us any further forward other than having to do a ground survey, but it makes a nonsense of STW’s attempts to make online access to maps difficult.

In STW’s parallel corporate universe you can have a two-year civil engineering project digging up 16 miles of the countryside with its attendant huge online archive of public planning documents all of which you can make invisible! Just as long as you don’t have an online opensource map!

Anyone feel like helping with the ground survey?


A guide to mapping Fire Hydrants in the UK


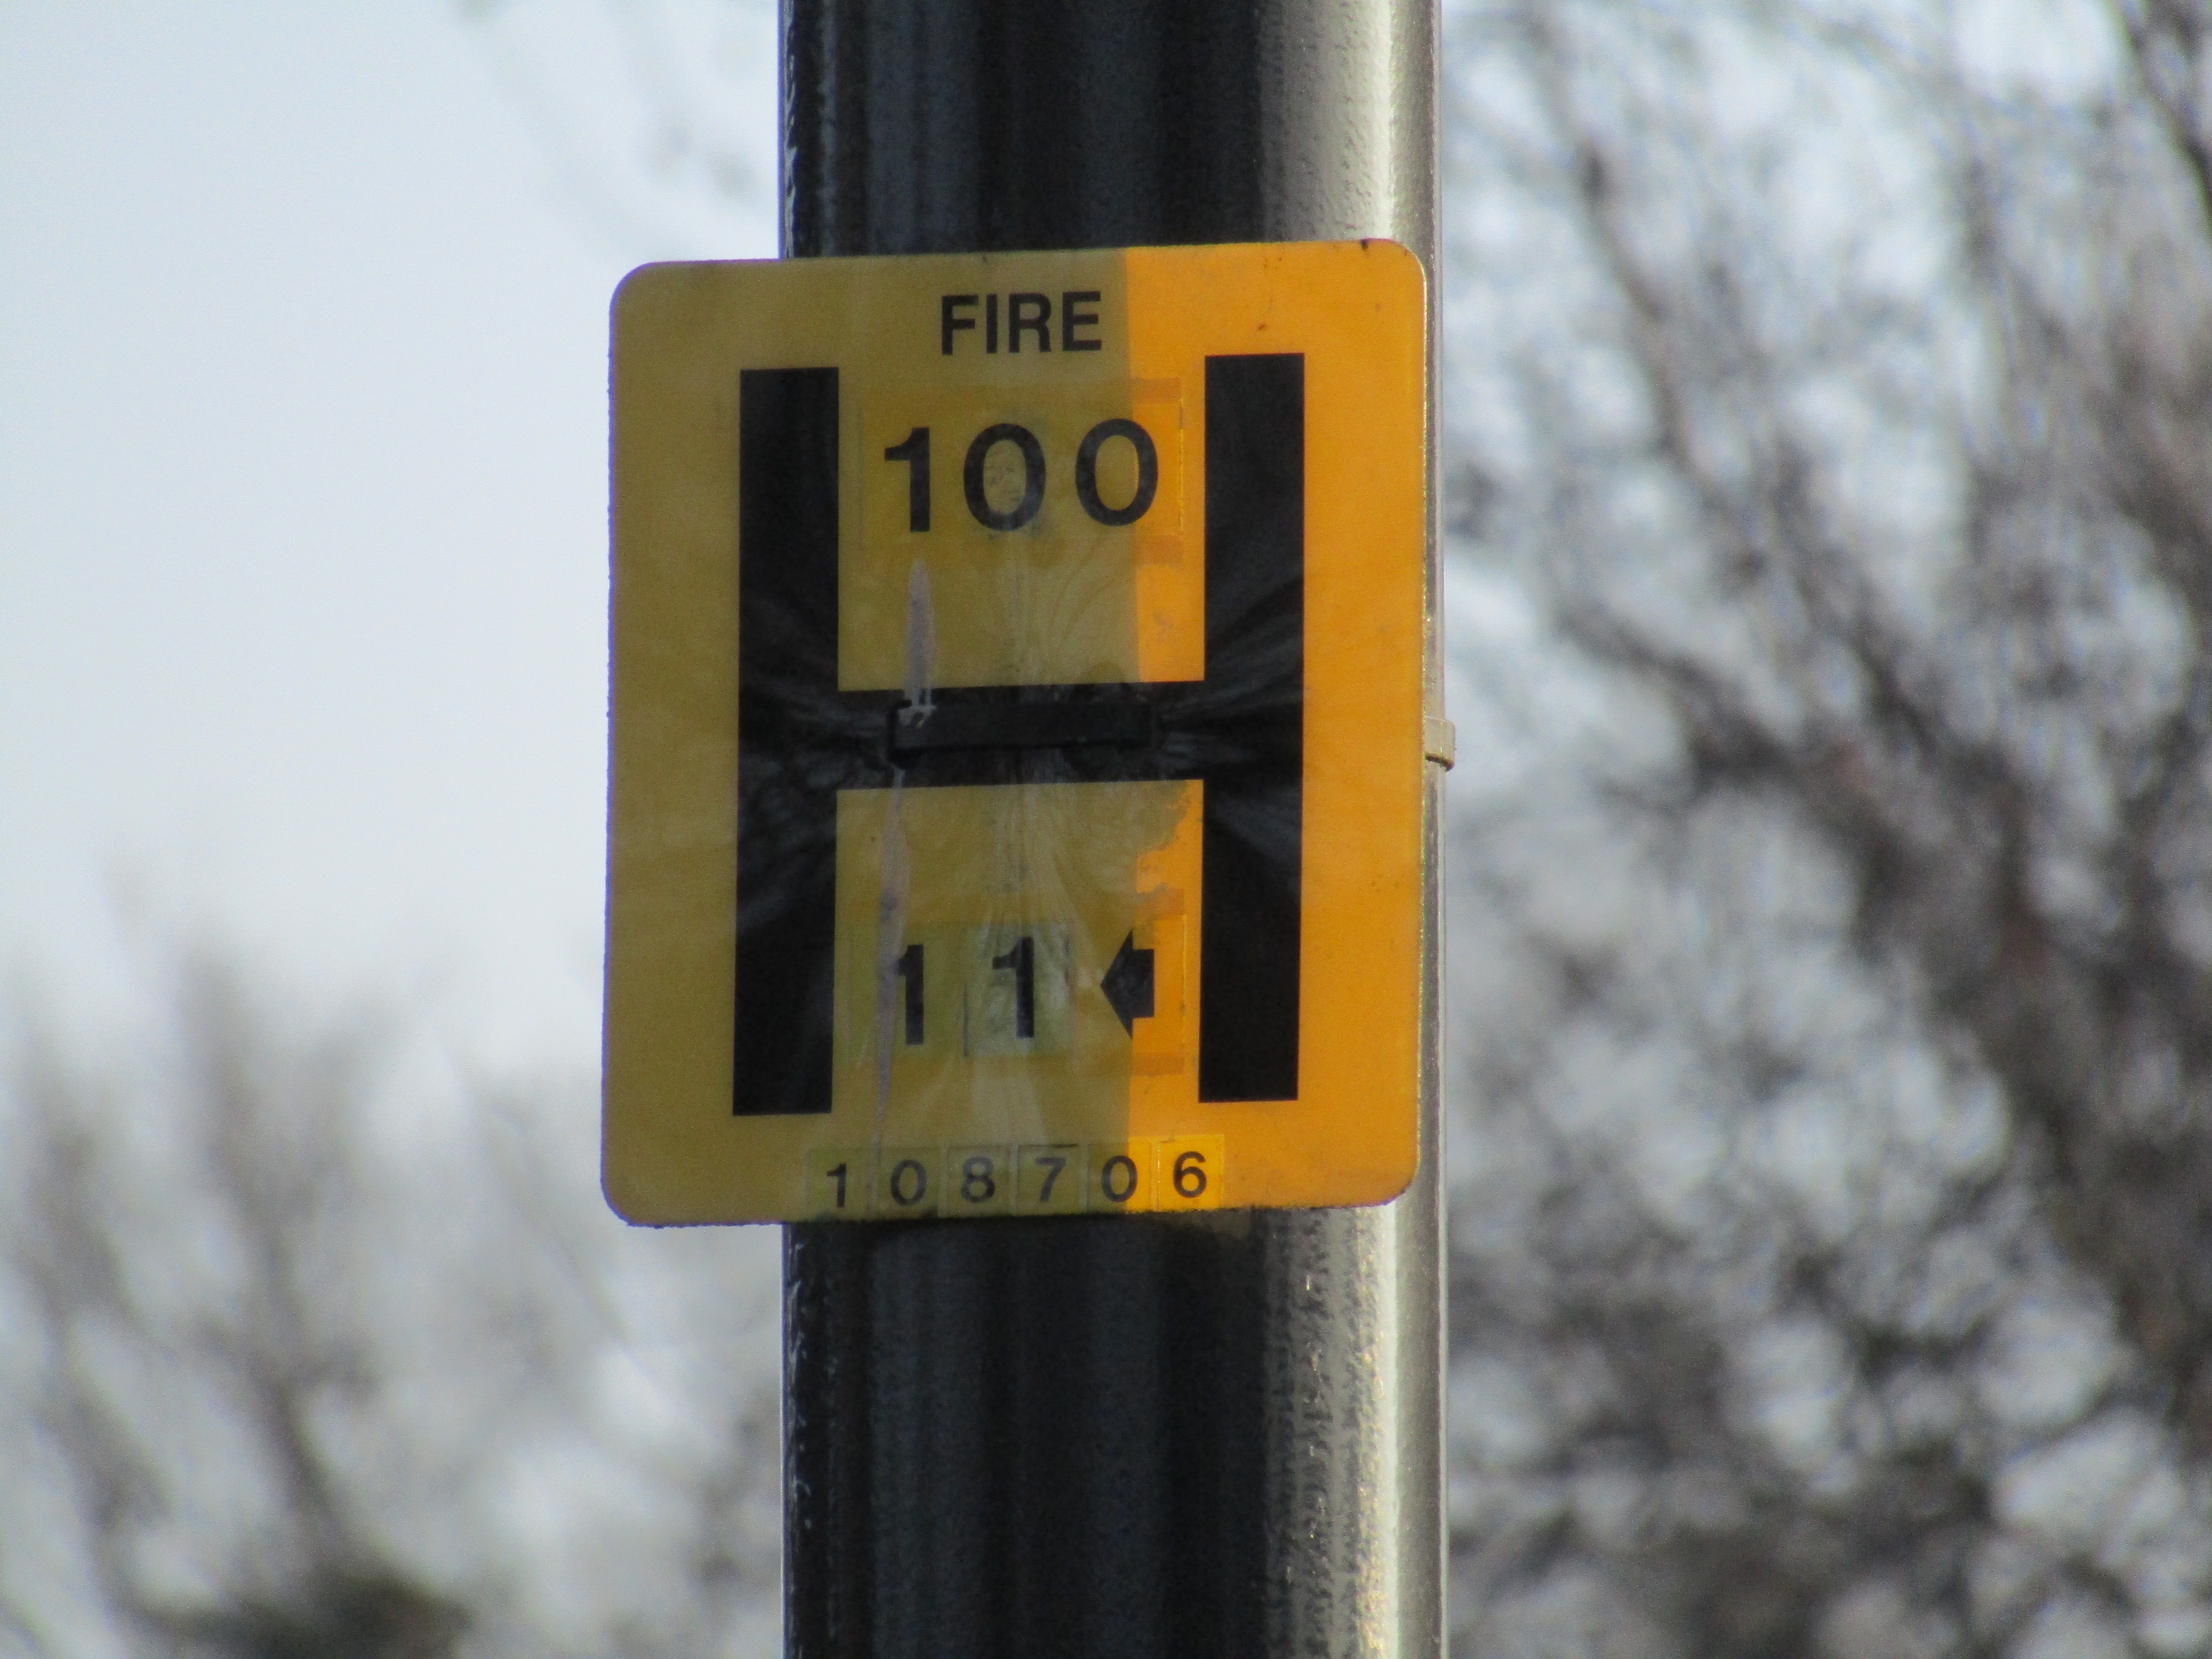
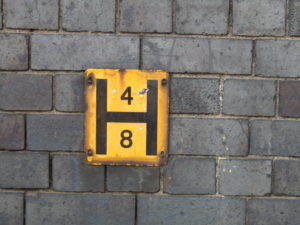
In the West Midlands our fire hydrant signs are generally placed on lamp posts:

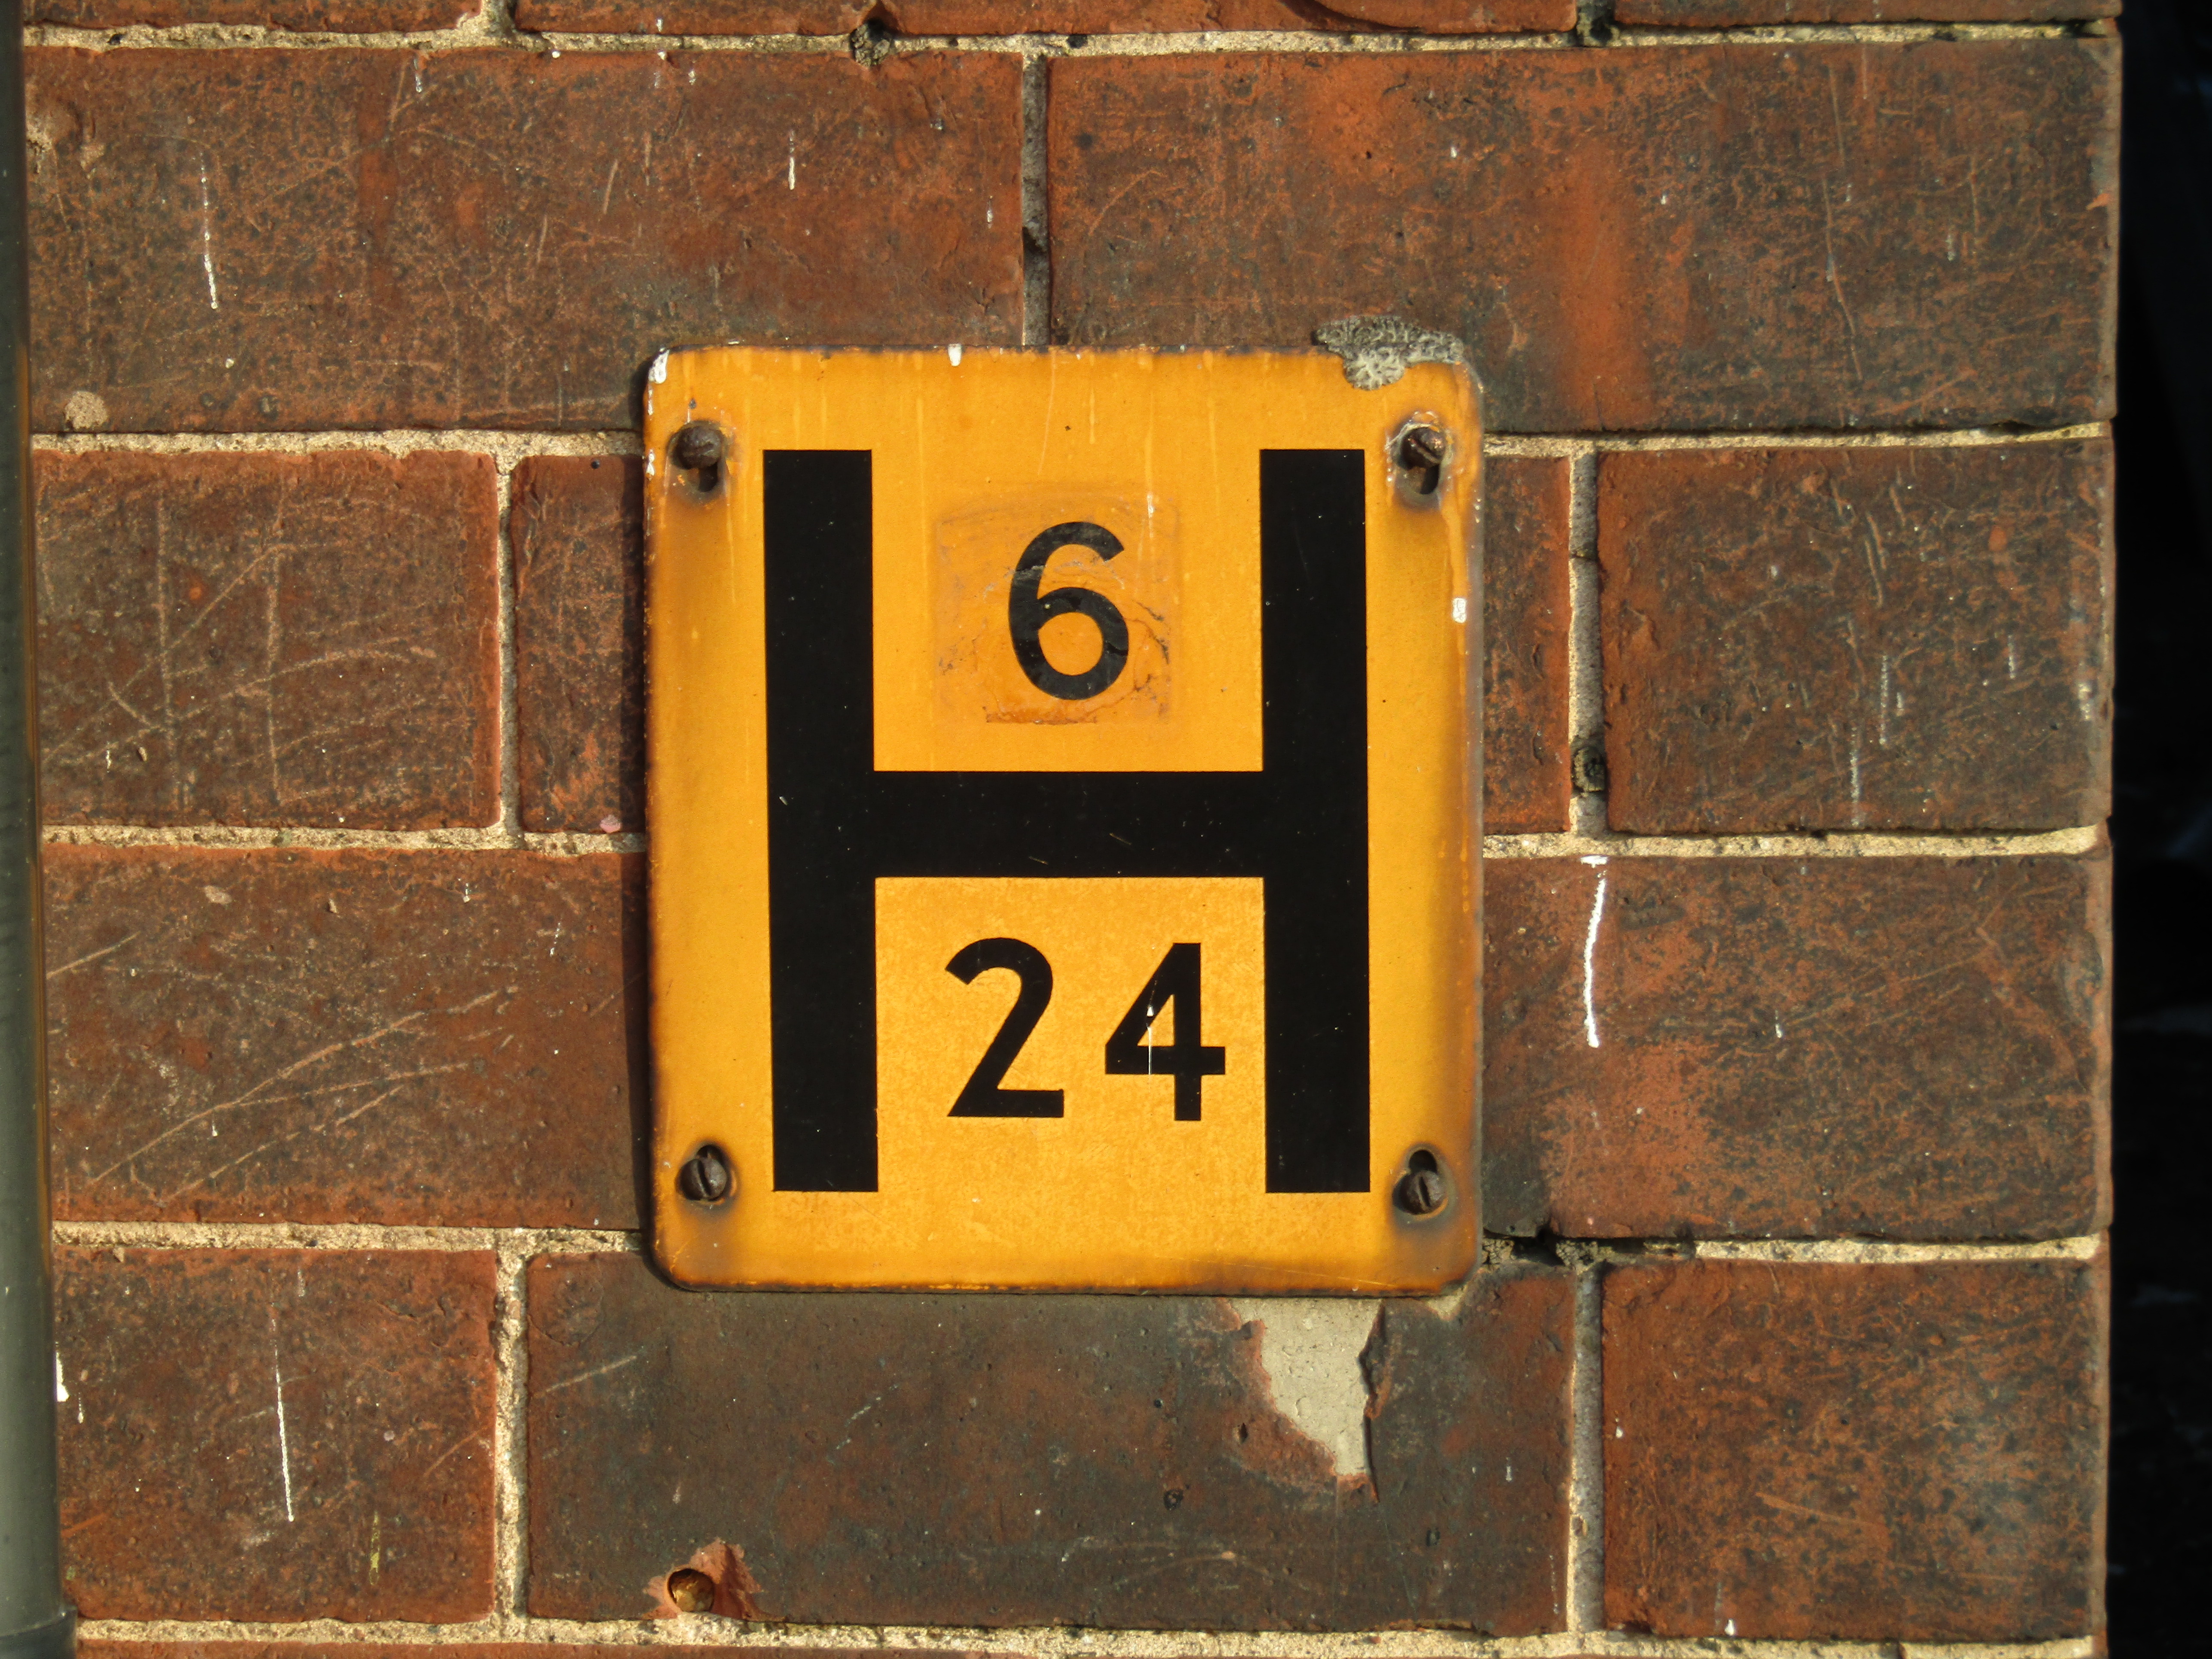
The black H on a yellow background I believe to be a UK standard. The upper number is the diameter of the underlying water main in mm. The lower number is the distance in feet to the fire hydrant from the sign with the arrow showing the direction to the actual hydrant. There is also a reference number at the foot of the sign. So, having spotted the sign, the actual fire hydrant has to be found. The signs can get swivelled on the lamposts through maintenance interventions or general neglect and the arrows point in the wrong direction!

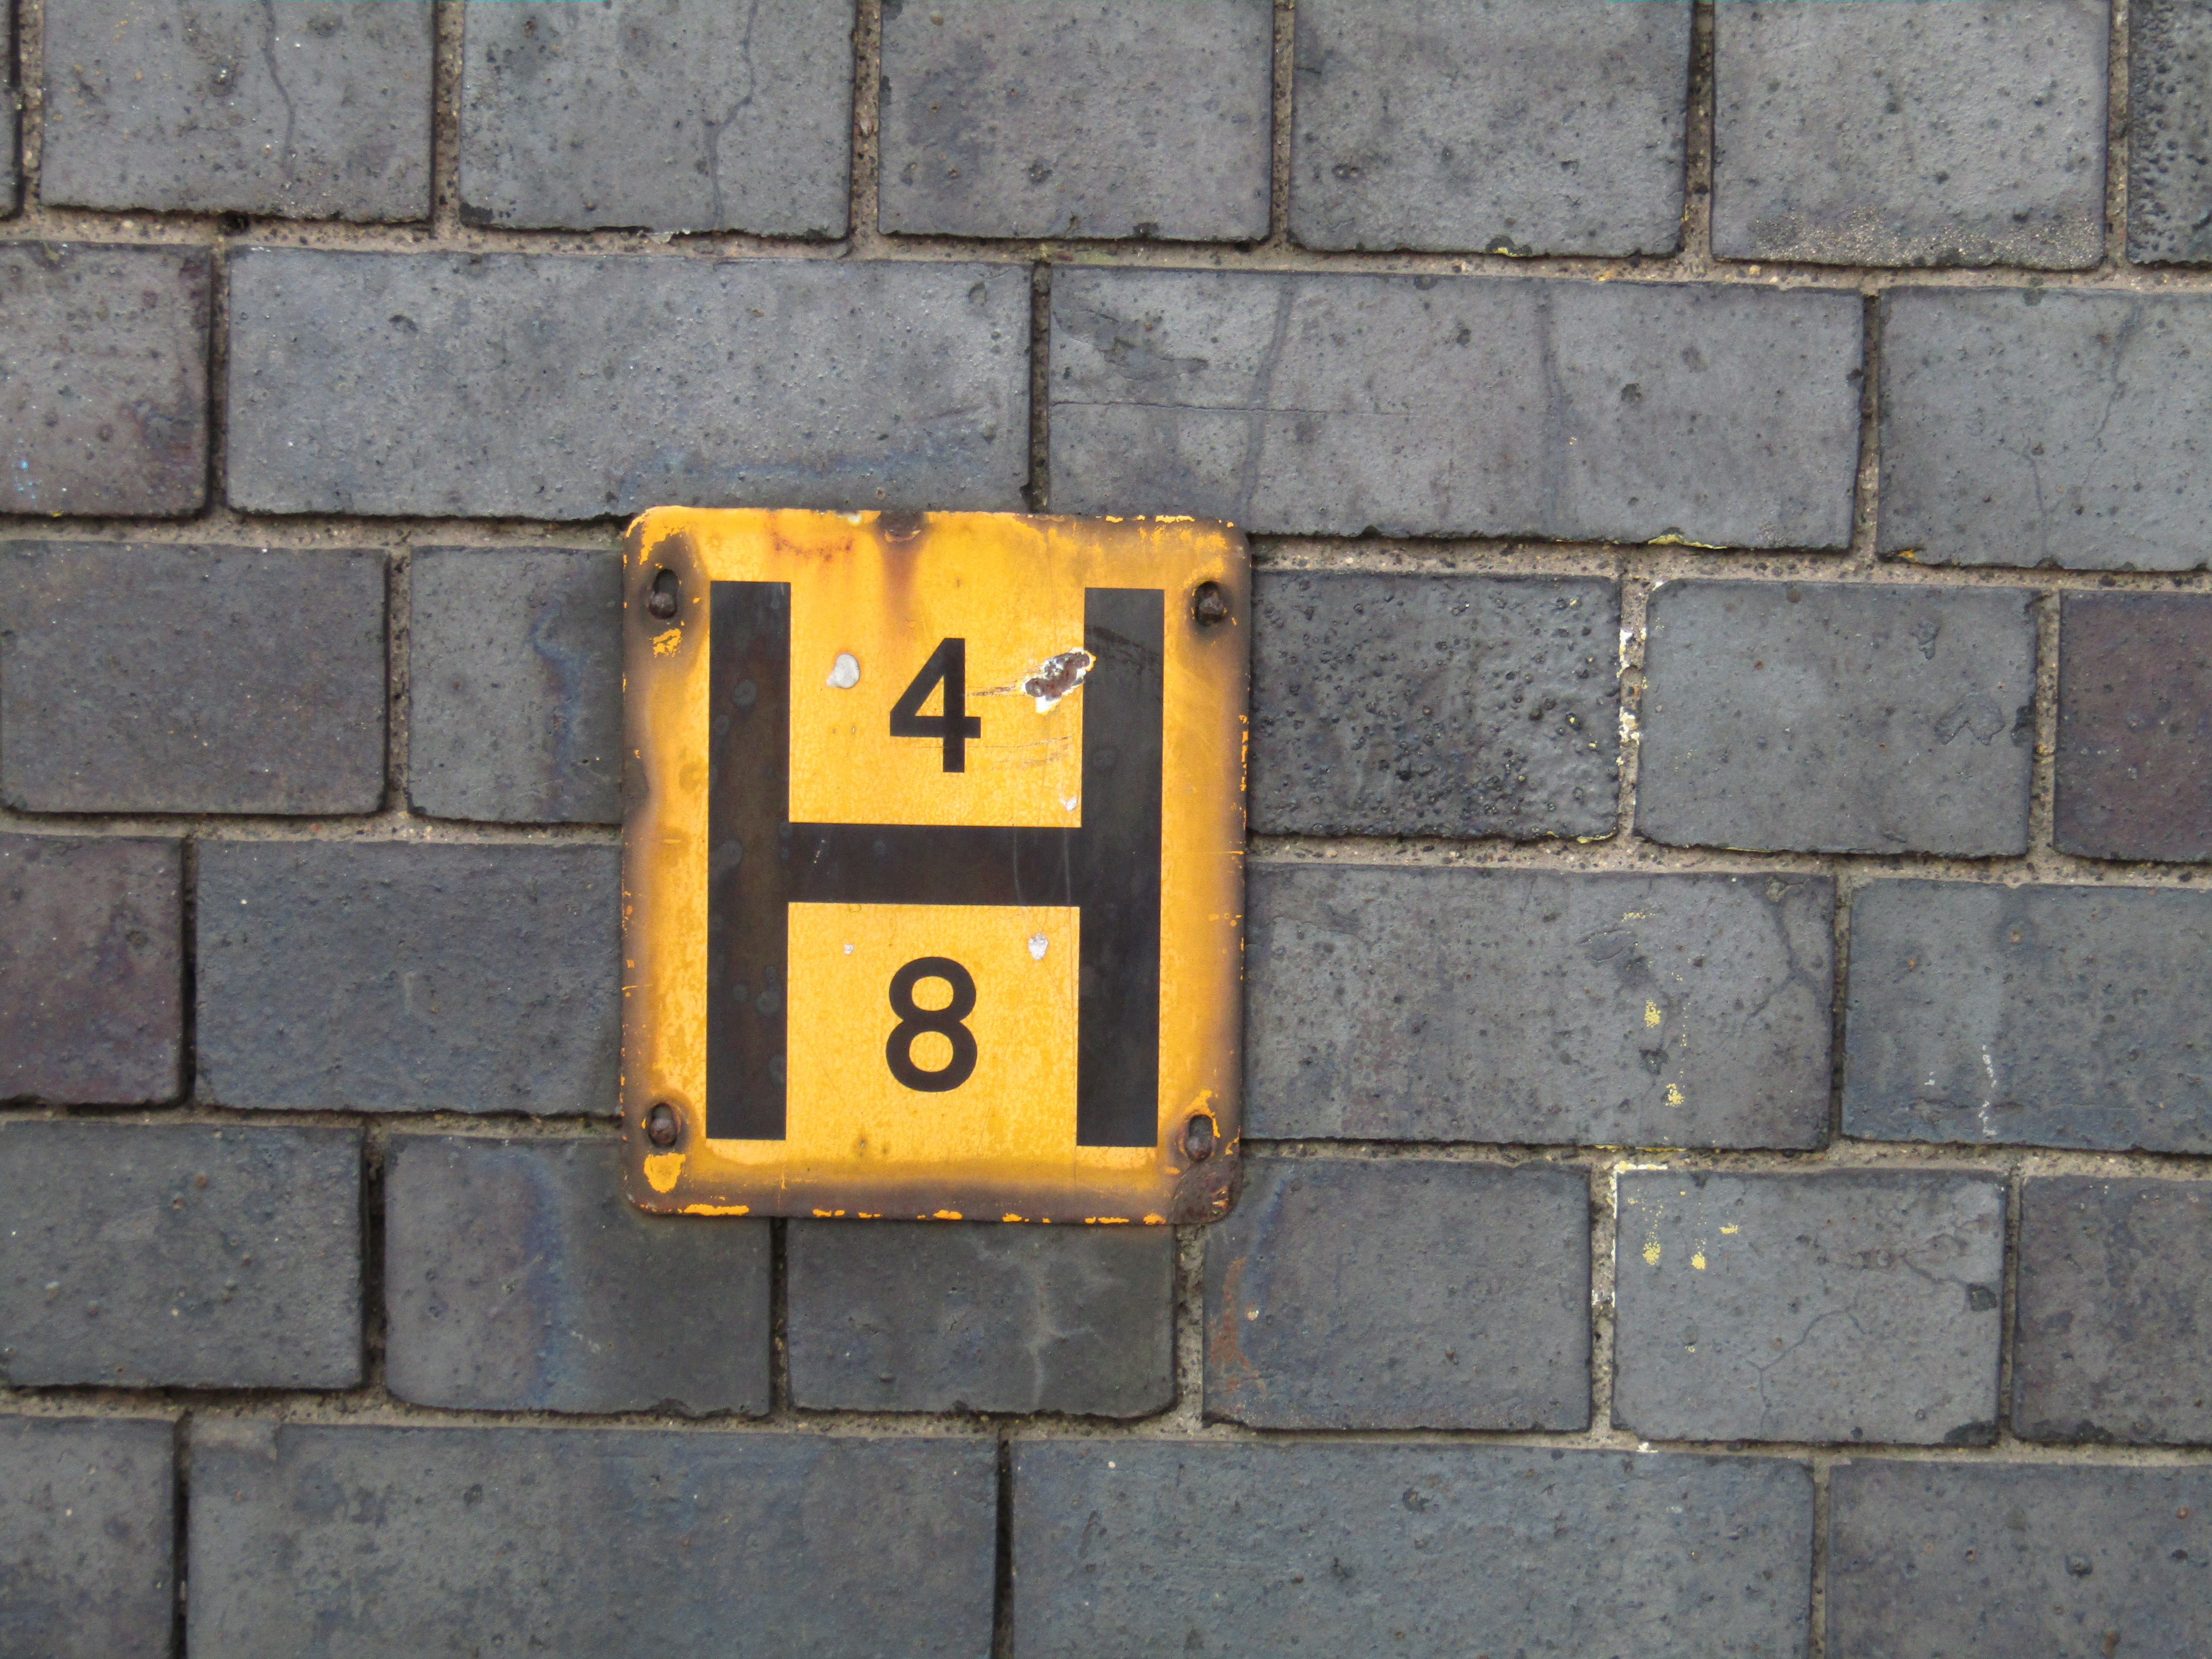
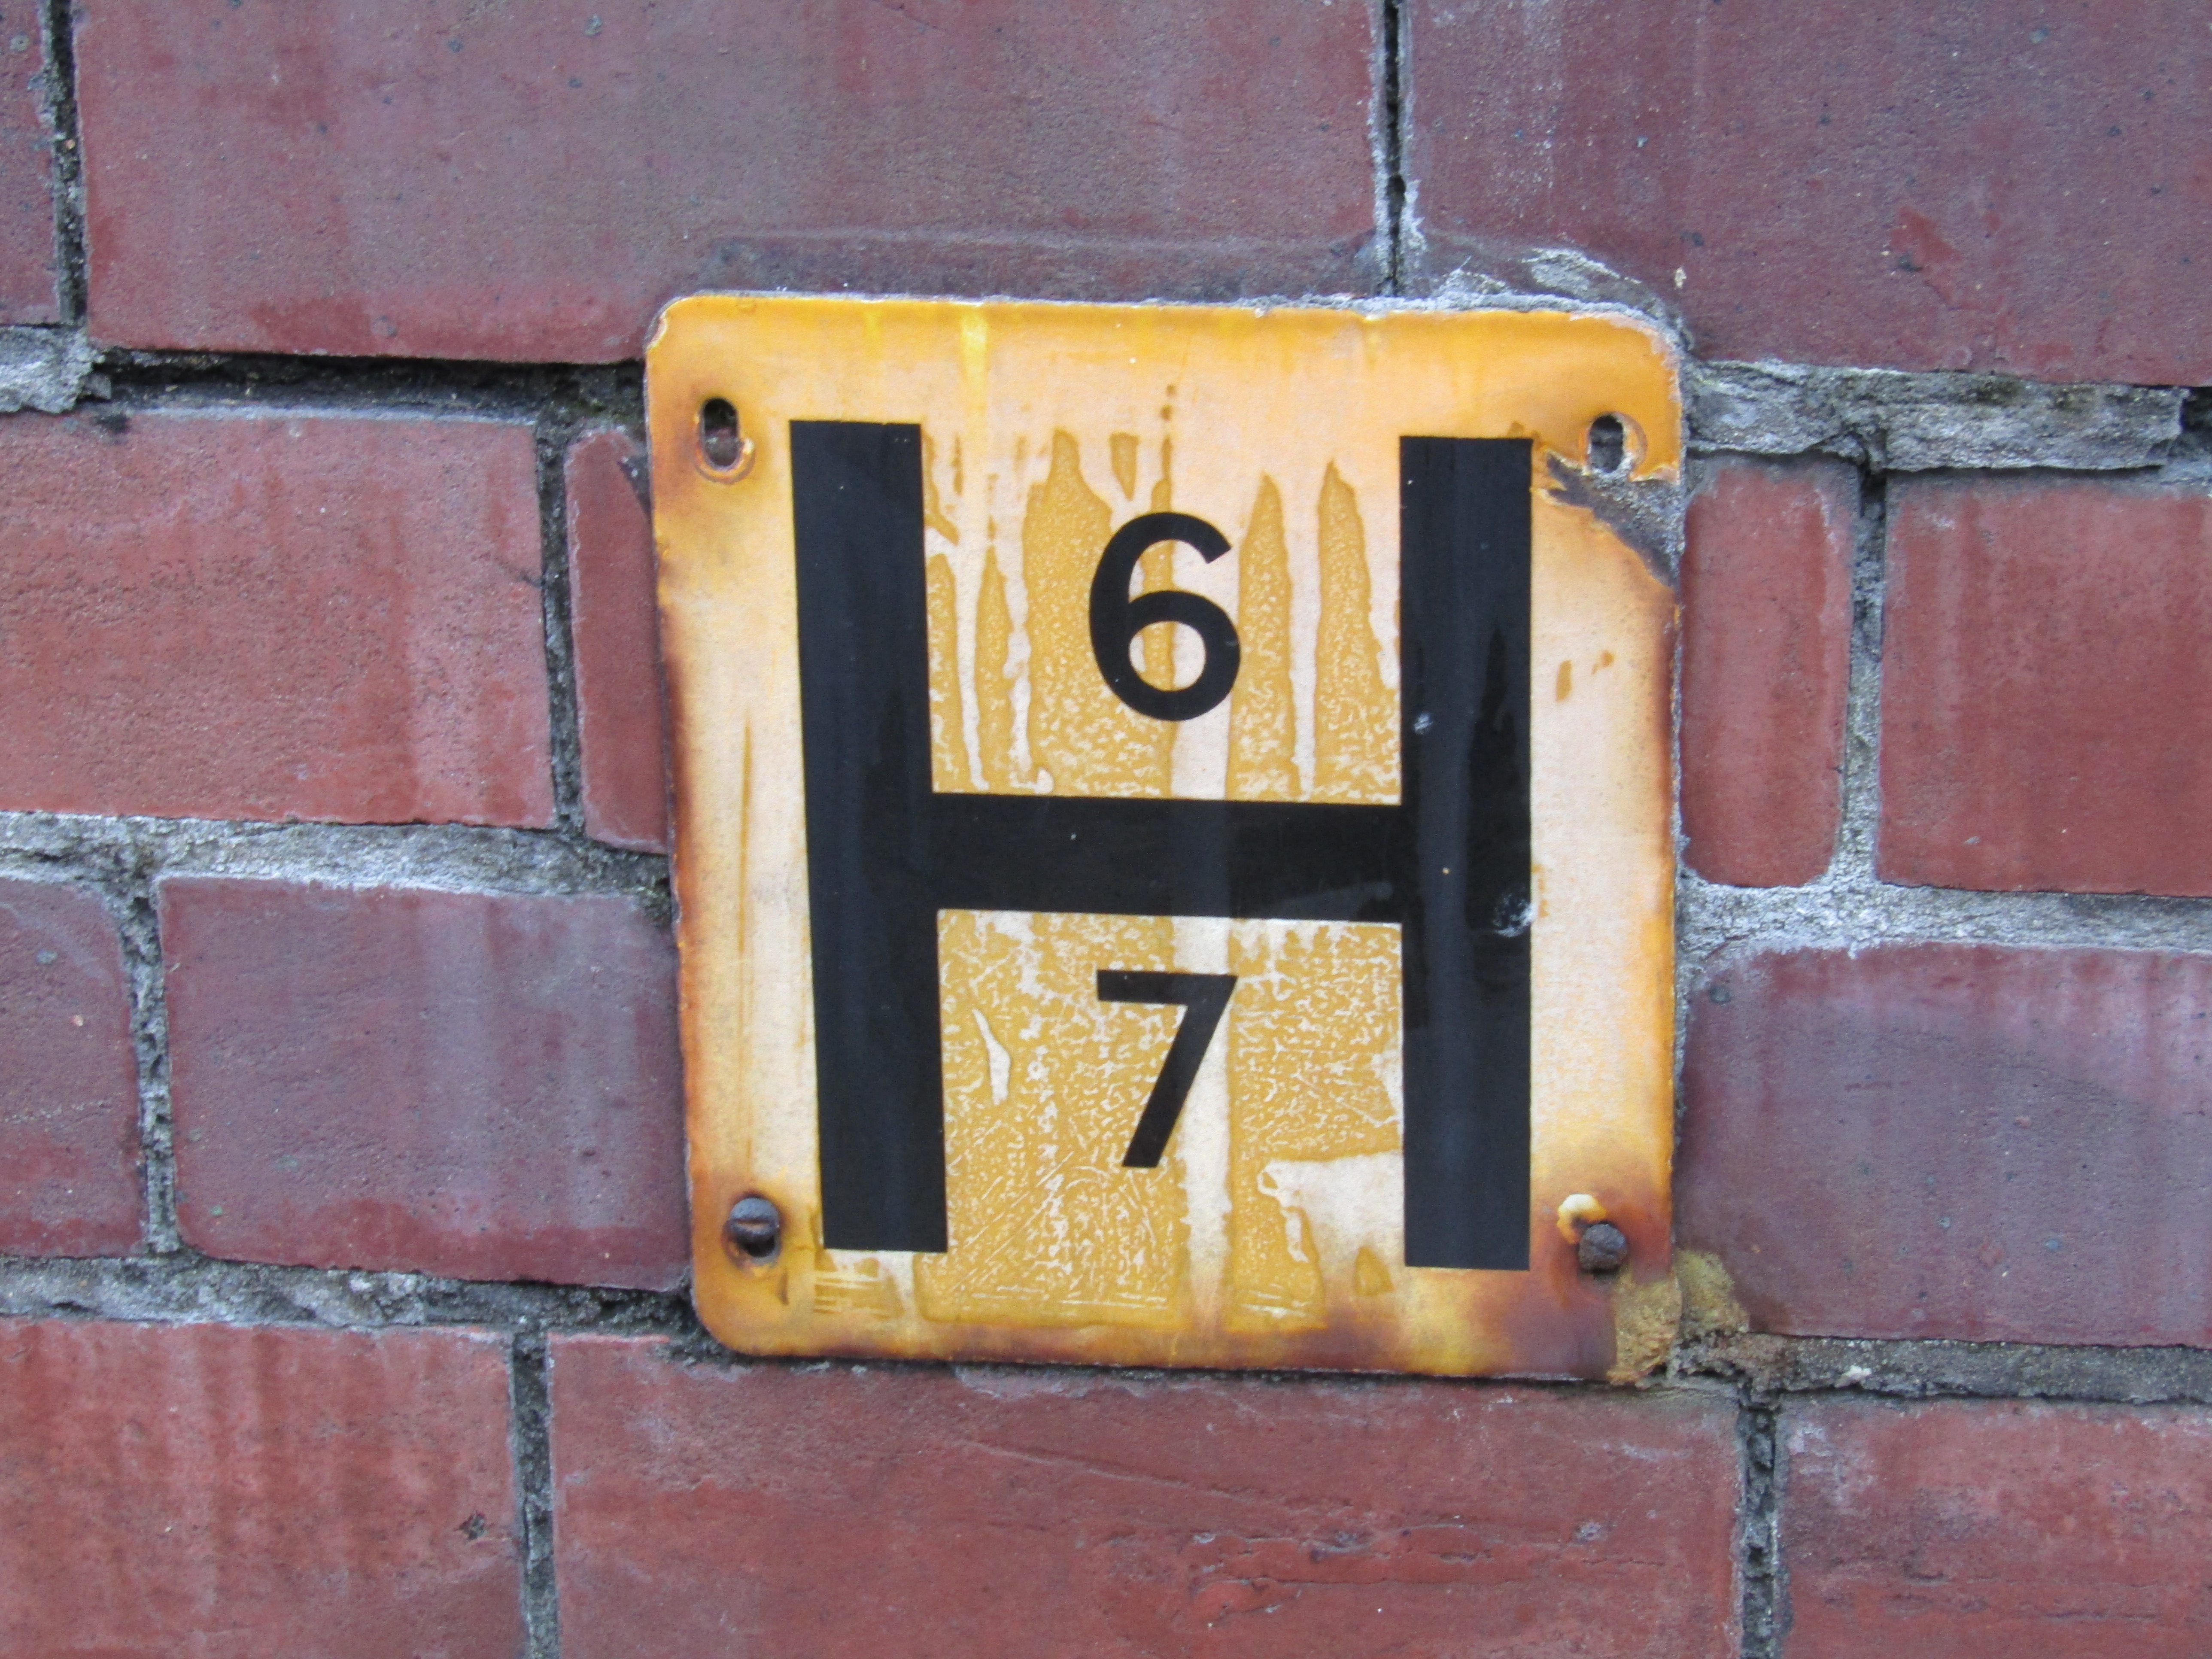
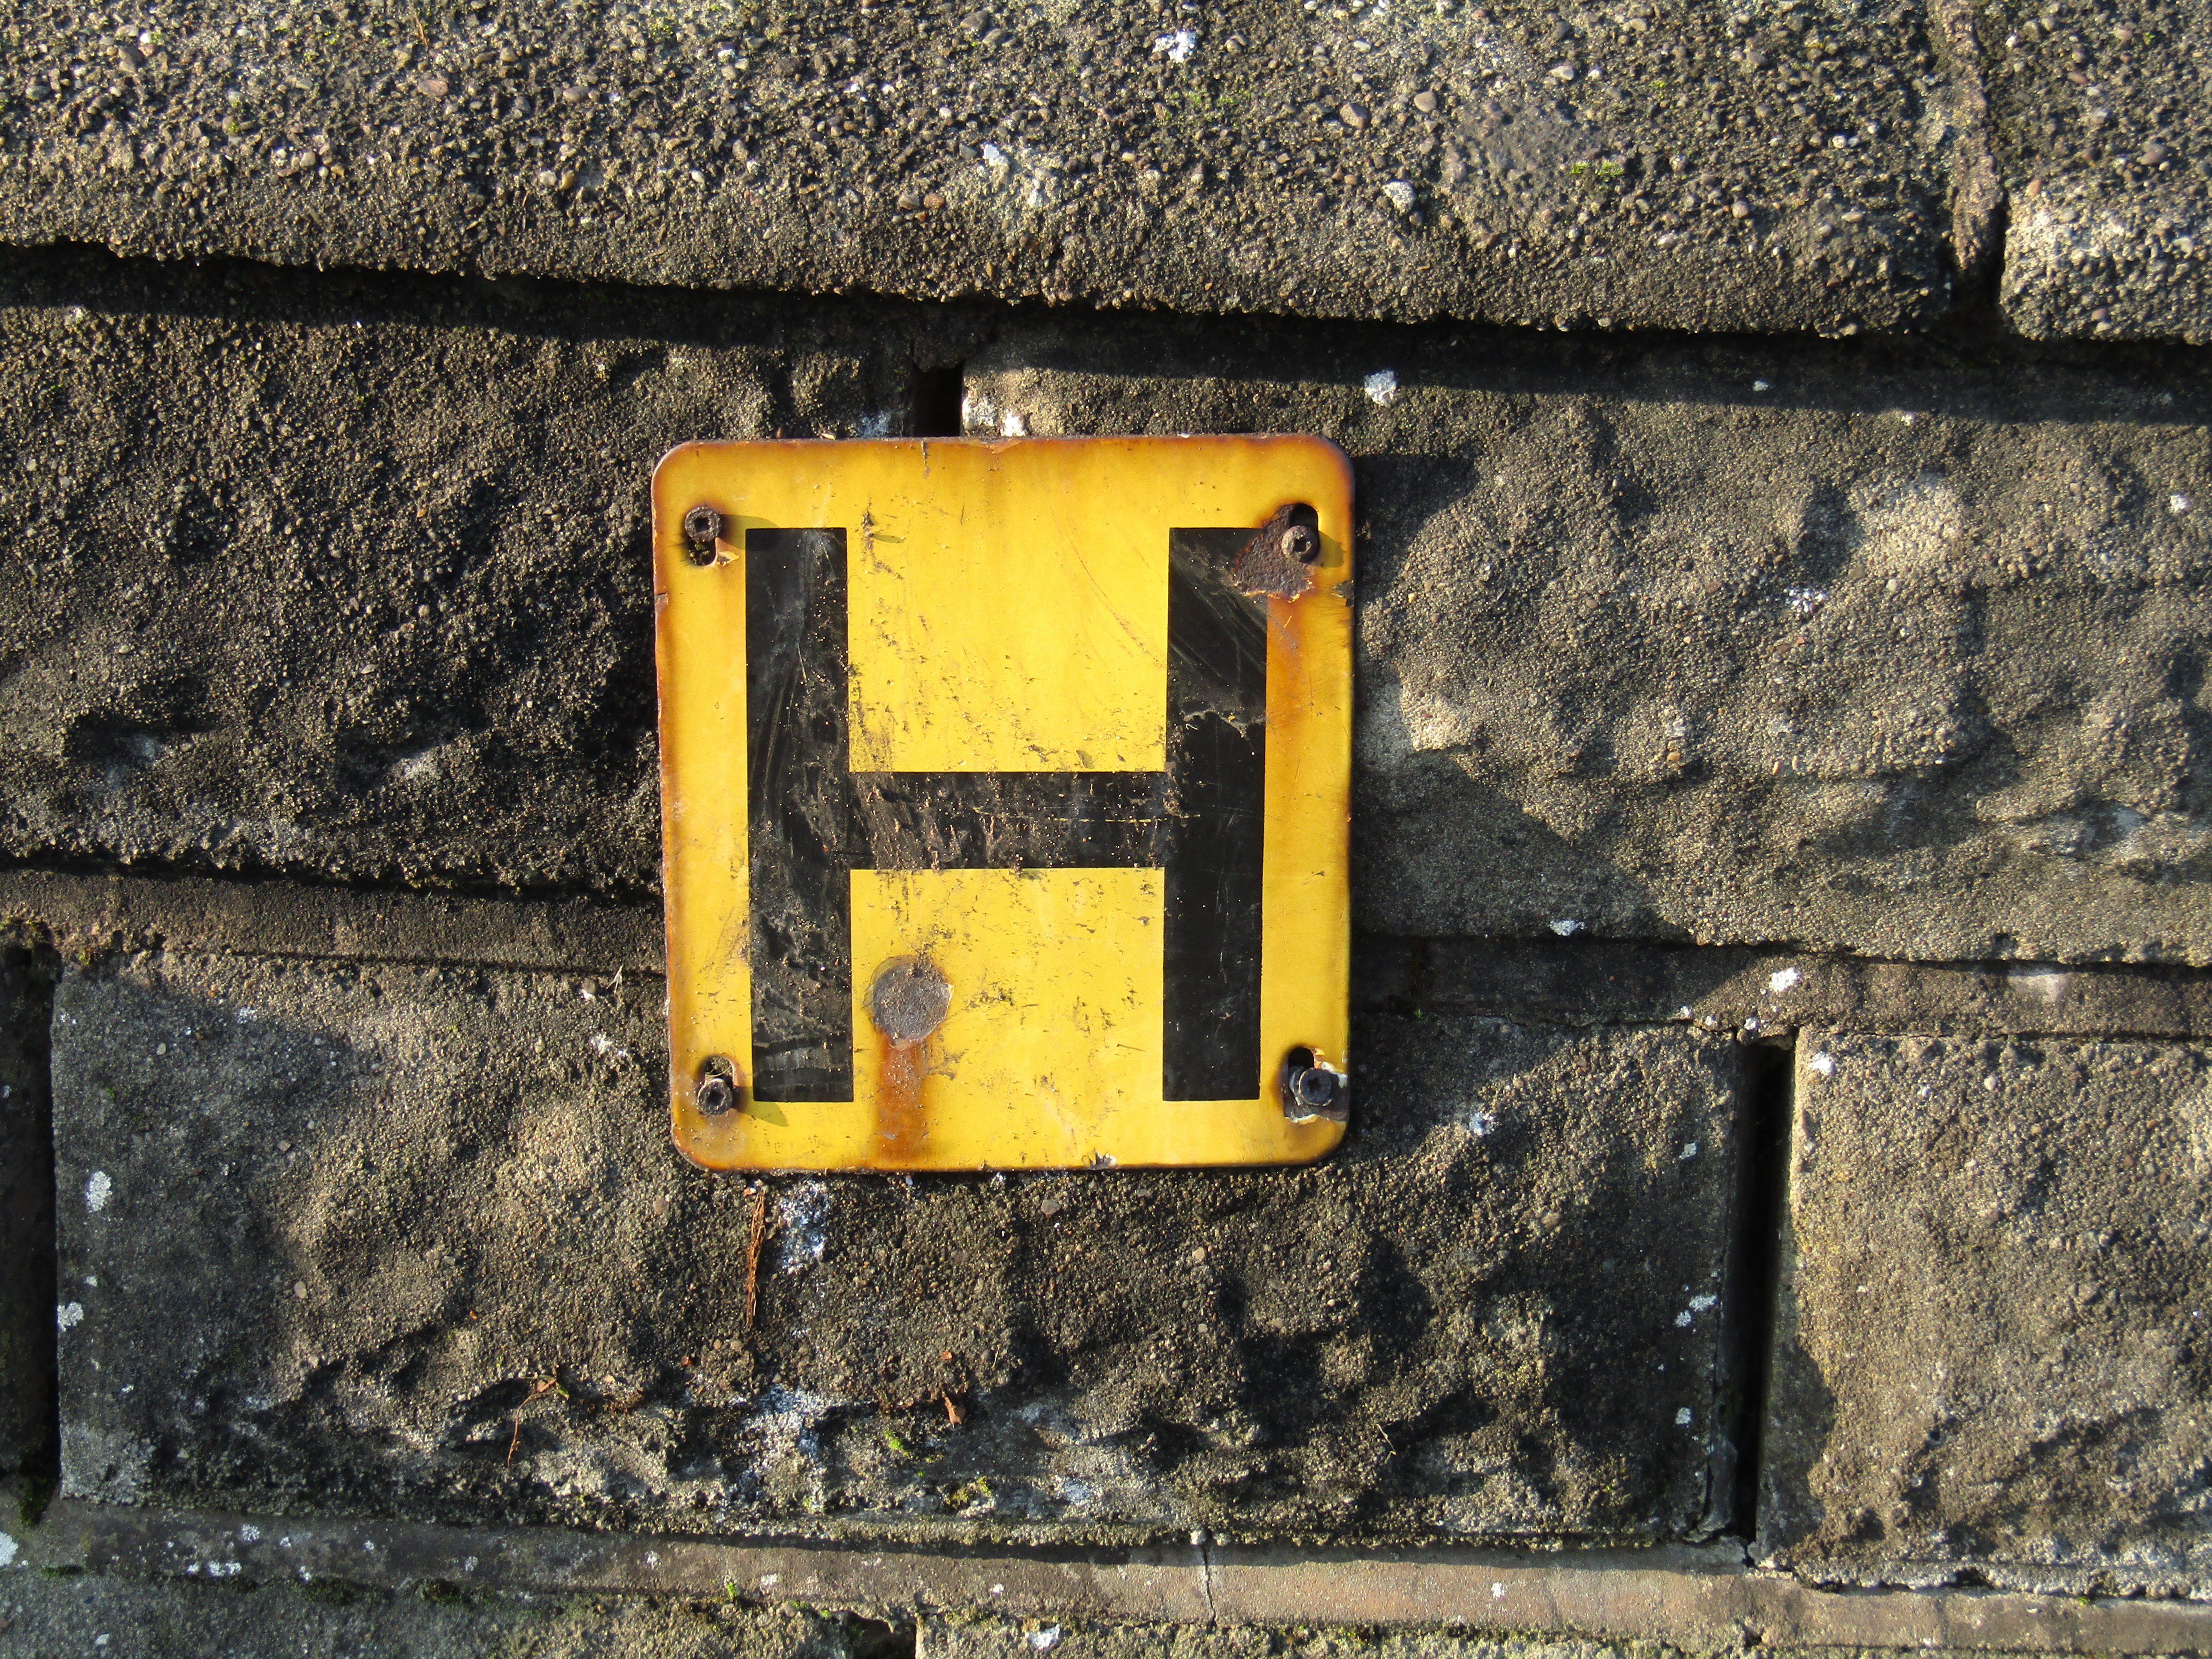
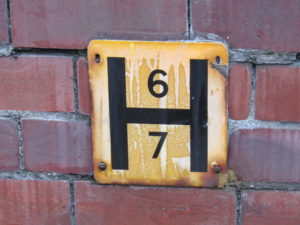
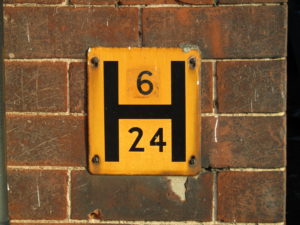
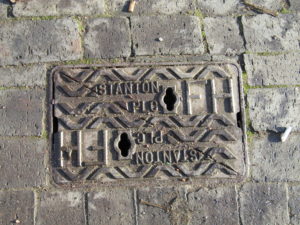
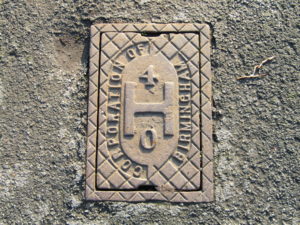
To complicate matters further, there are some fire hydrants that do not have a sign, and some older variants of the signs. These older signs tend to be attached to buildings or walls and I have no idea what the numbers refer to.

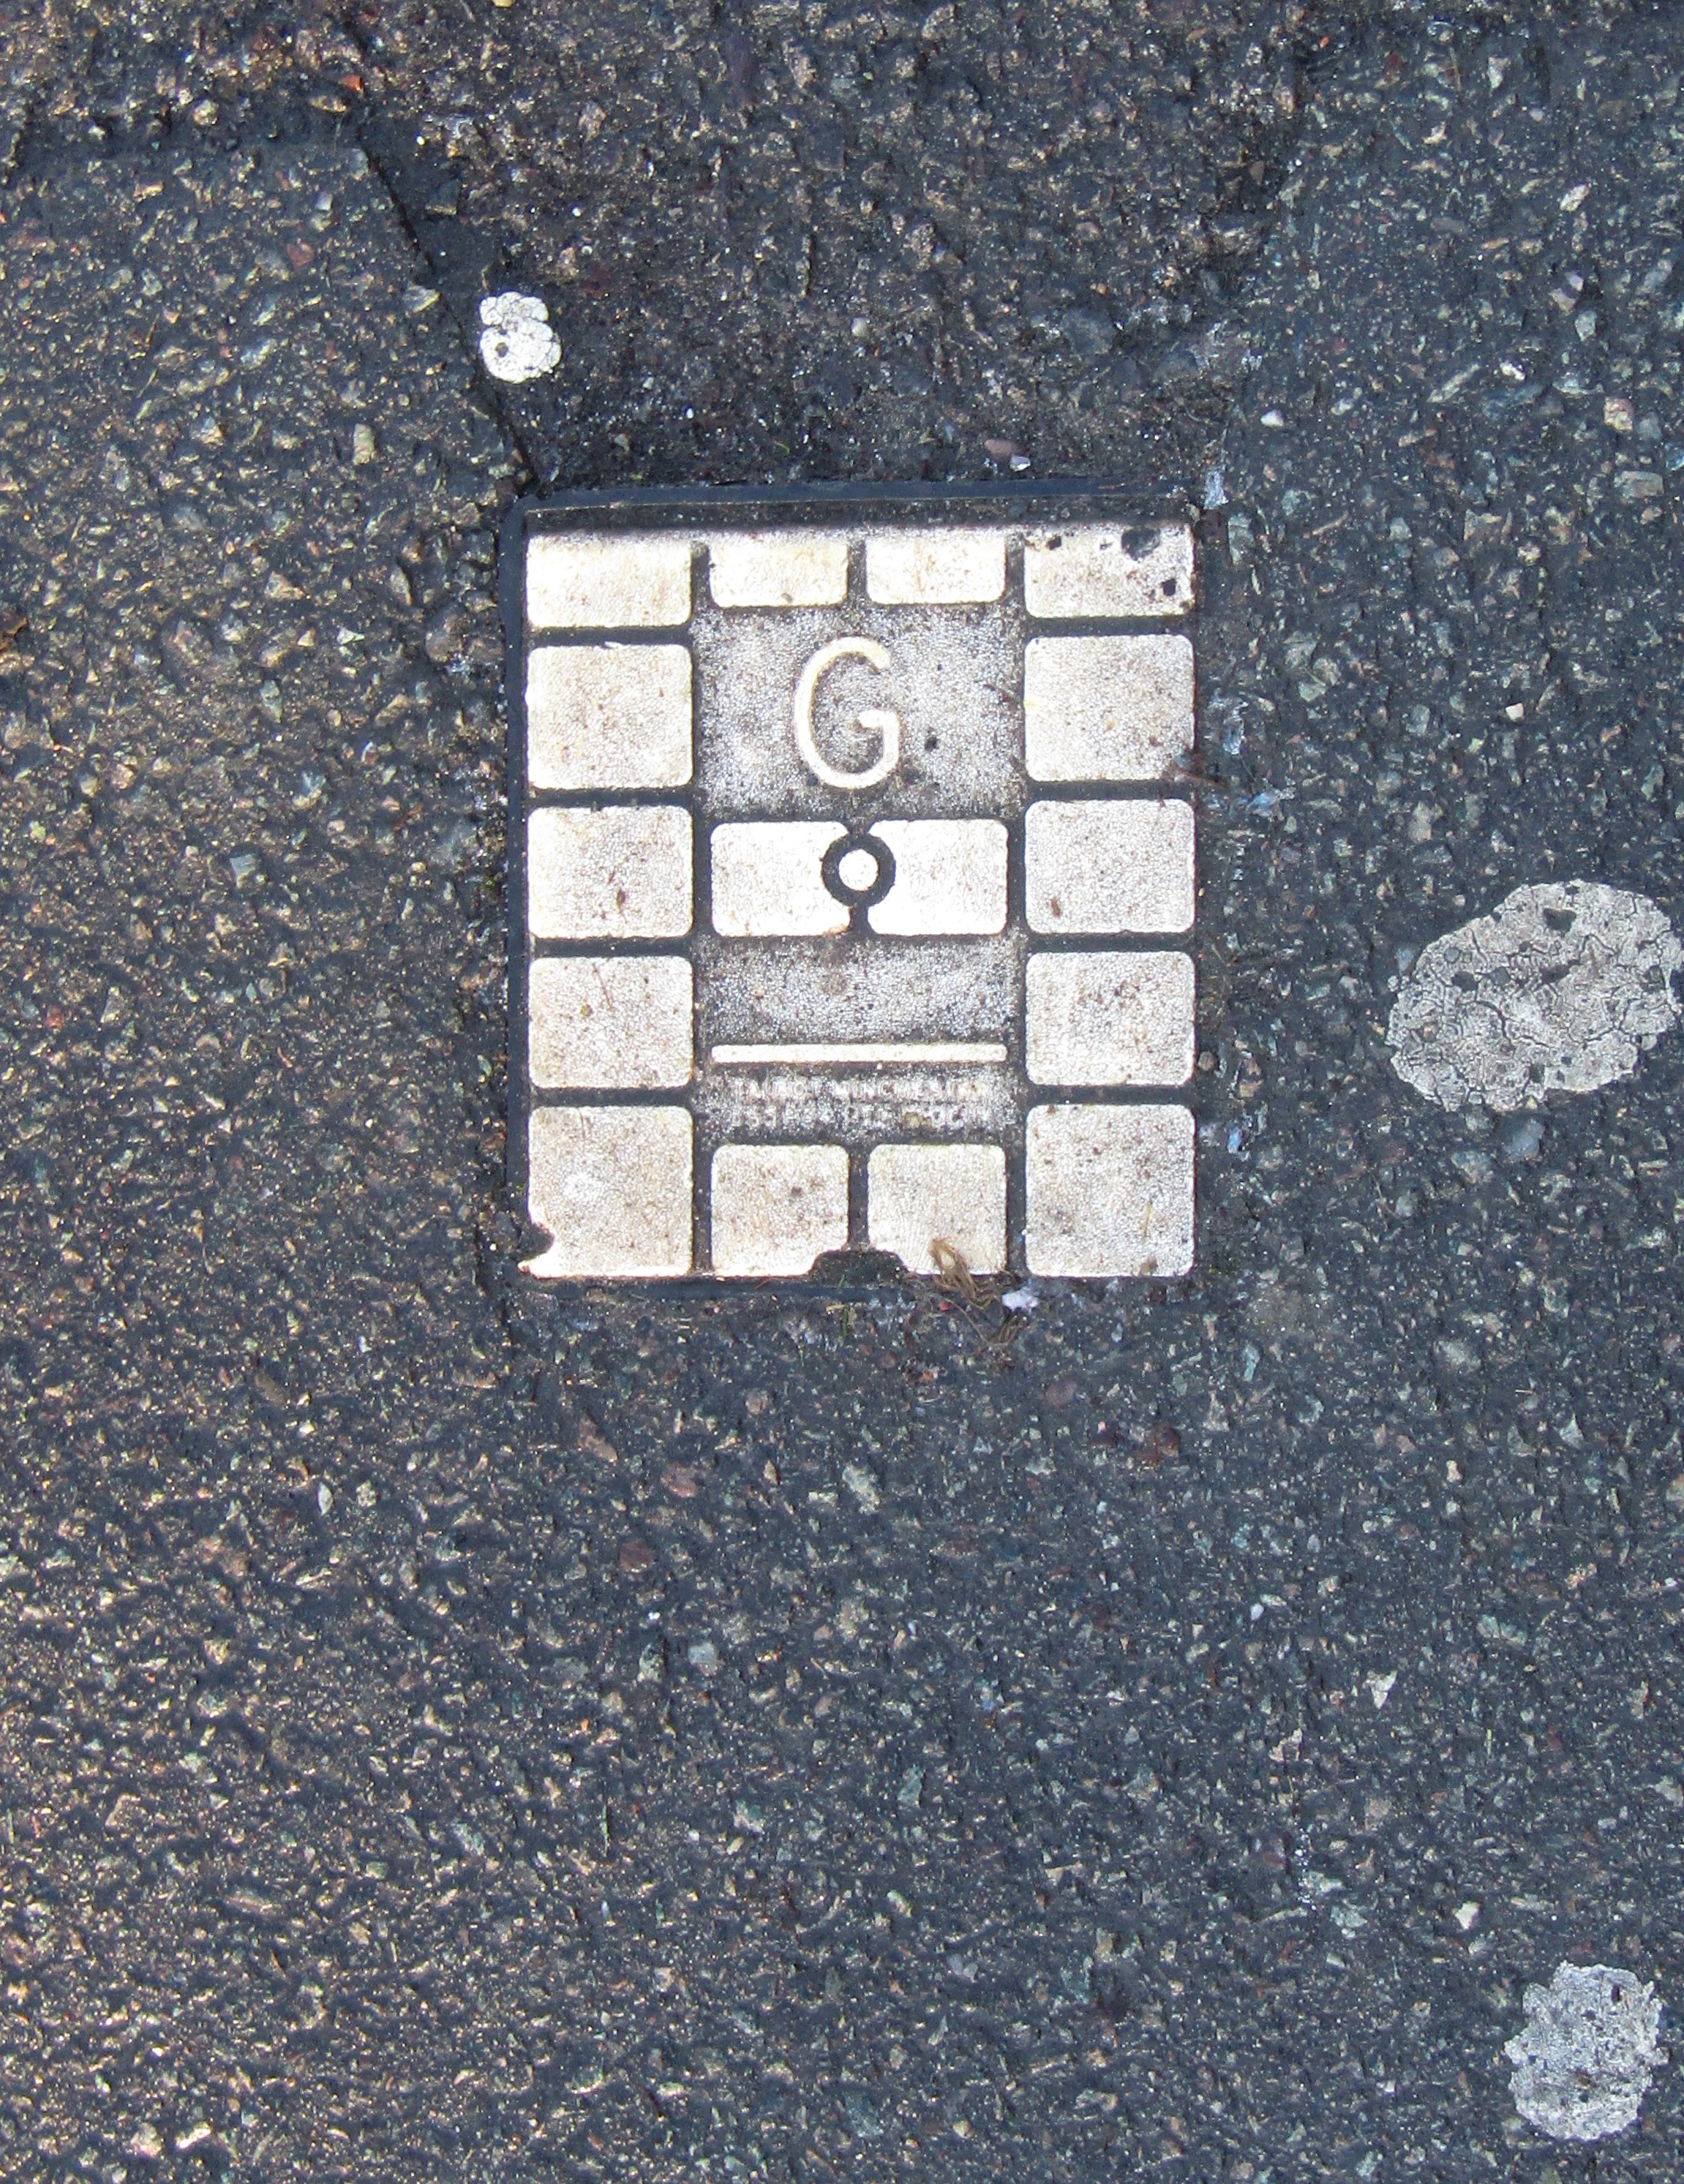
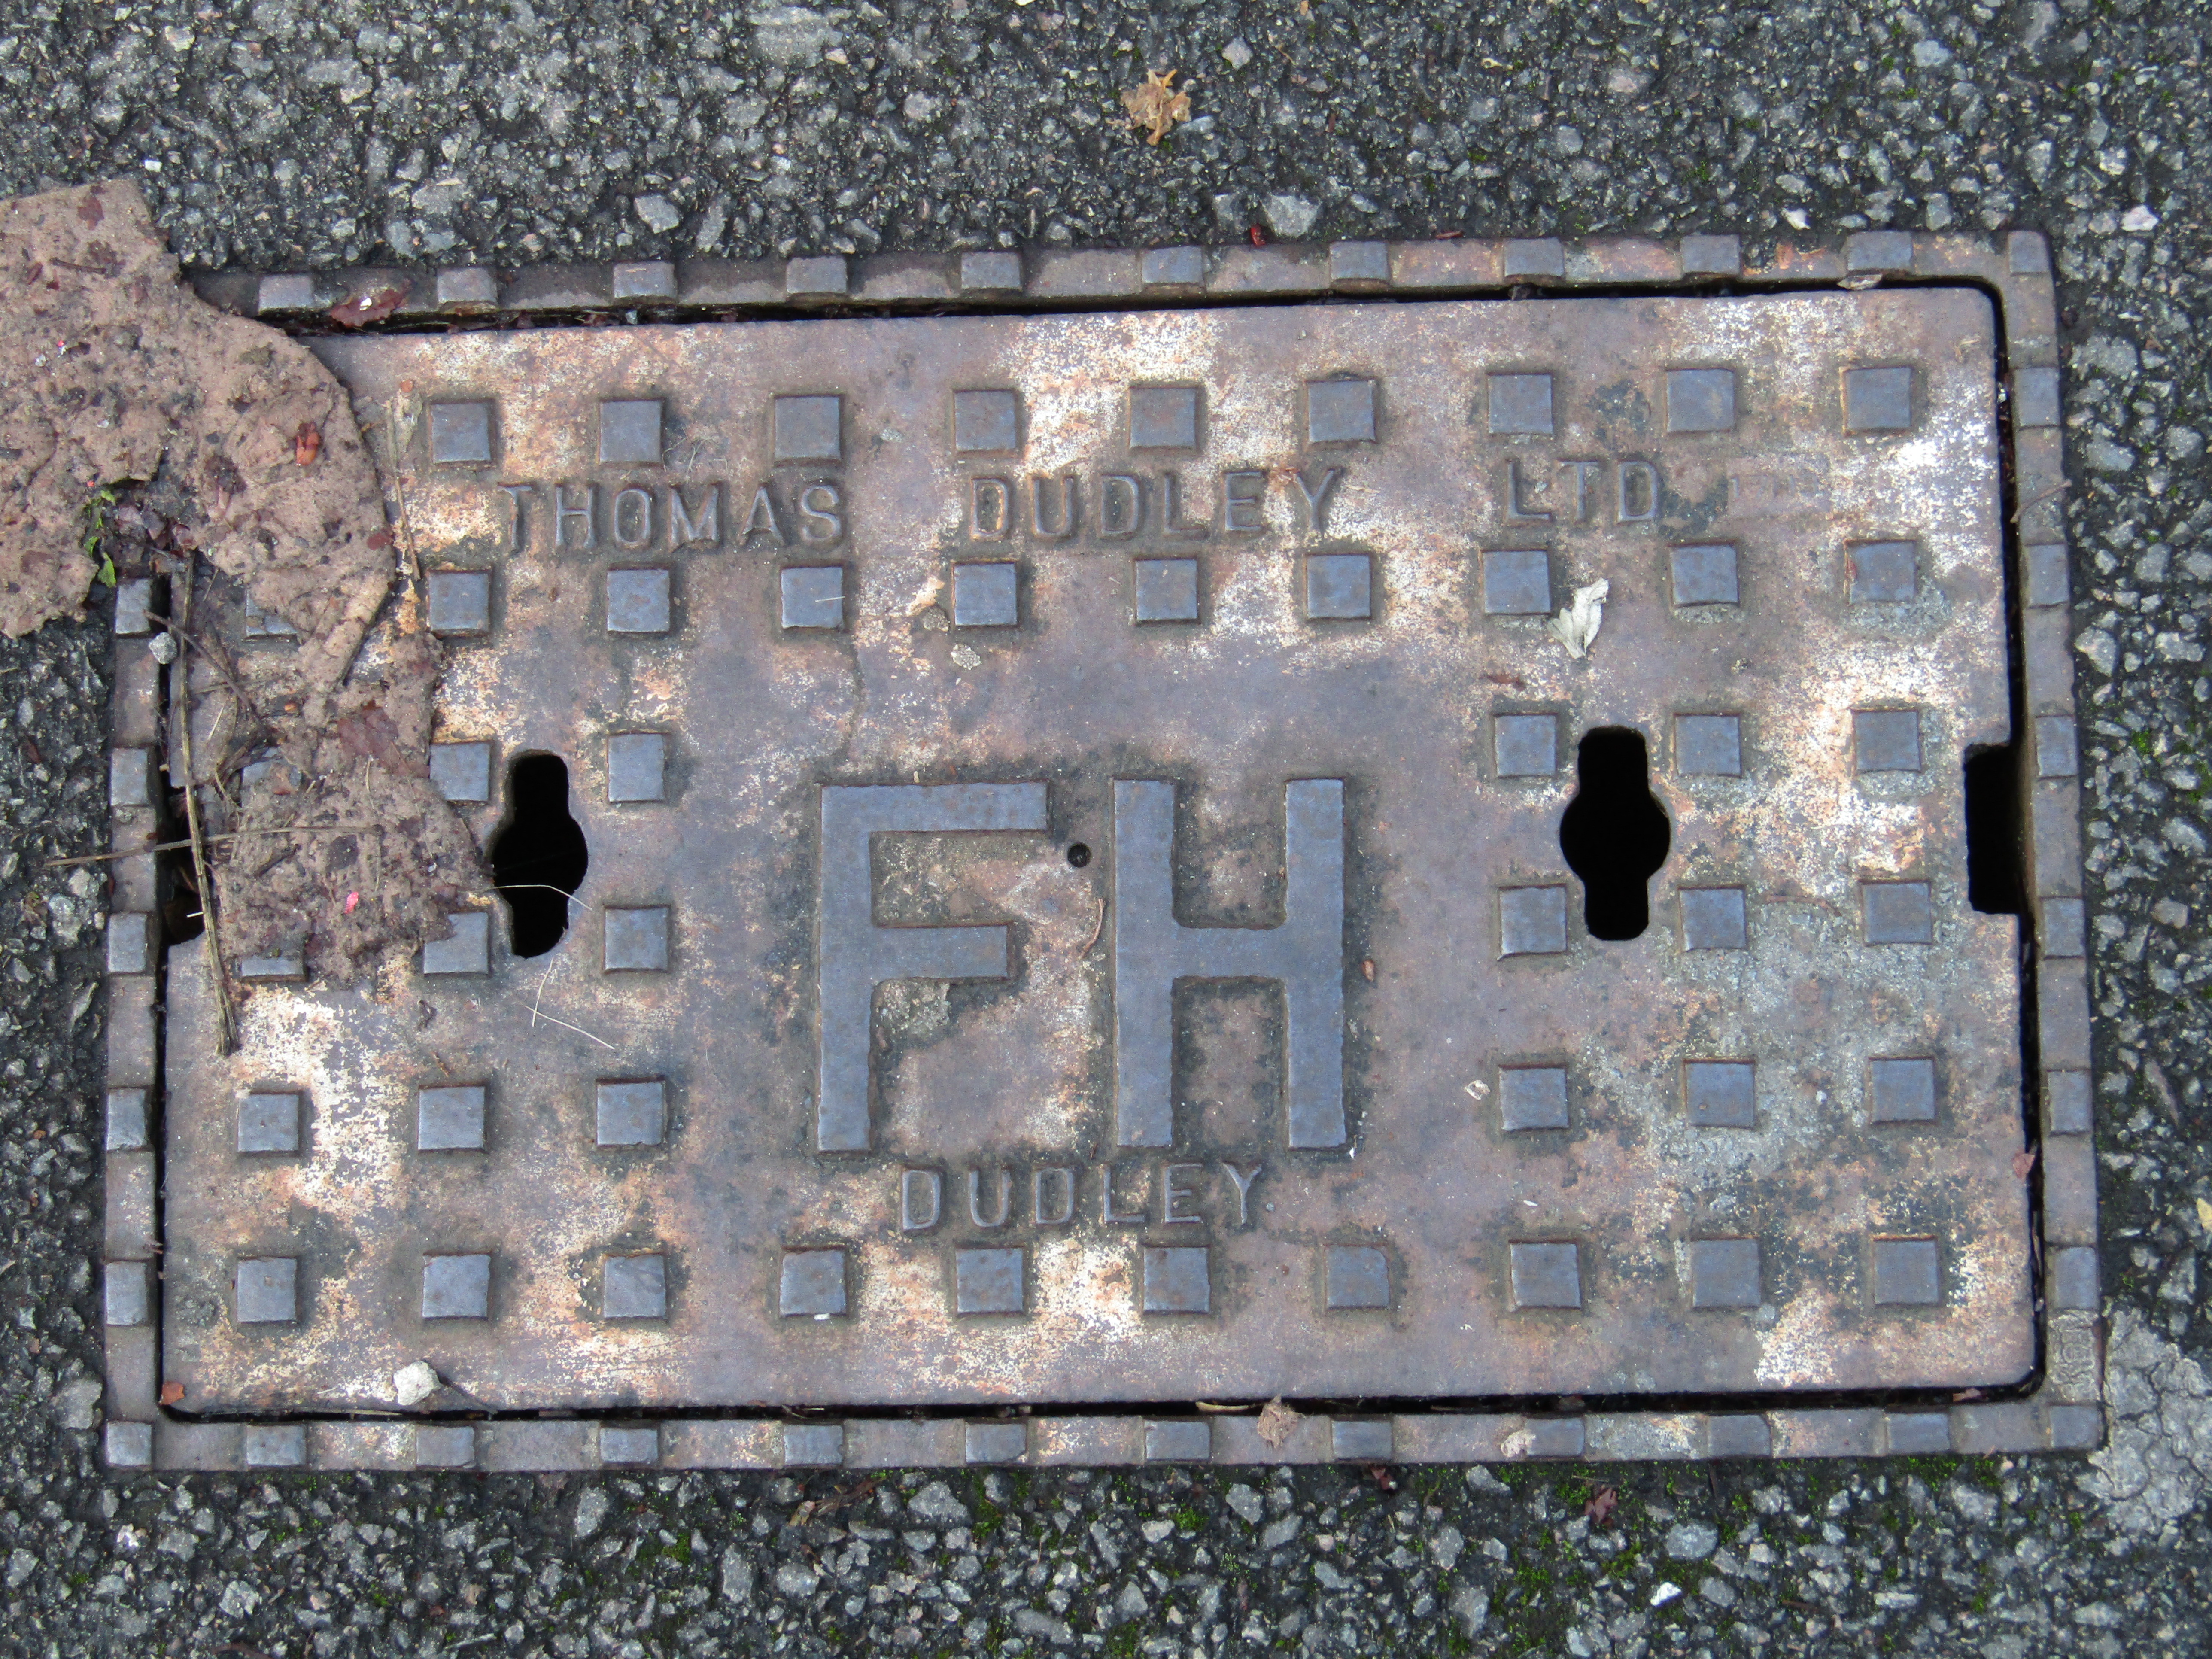
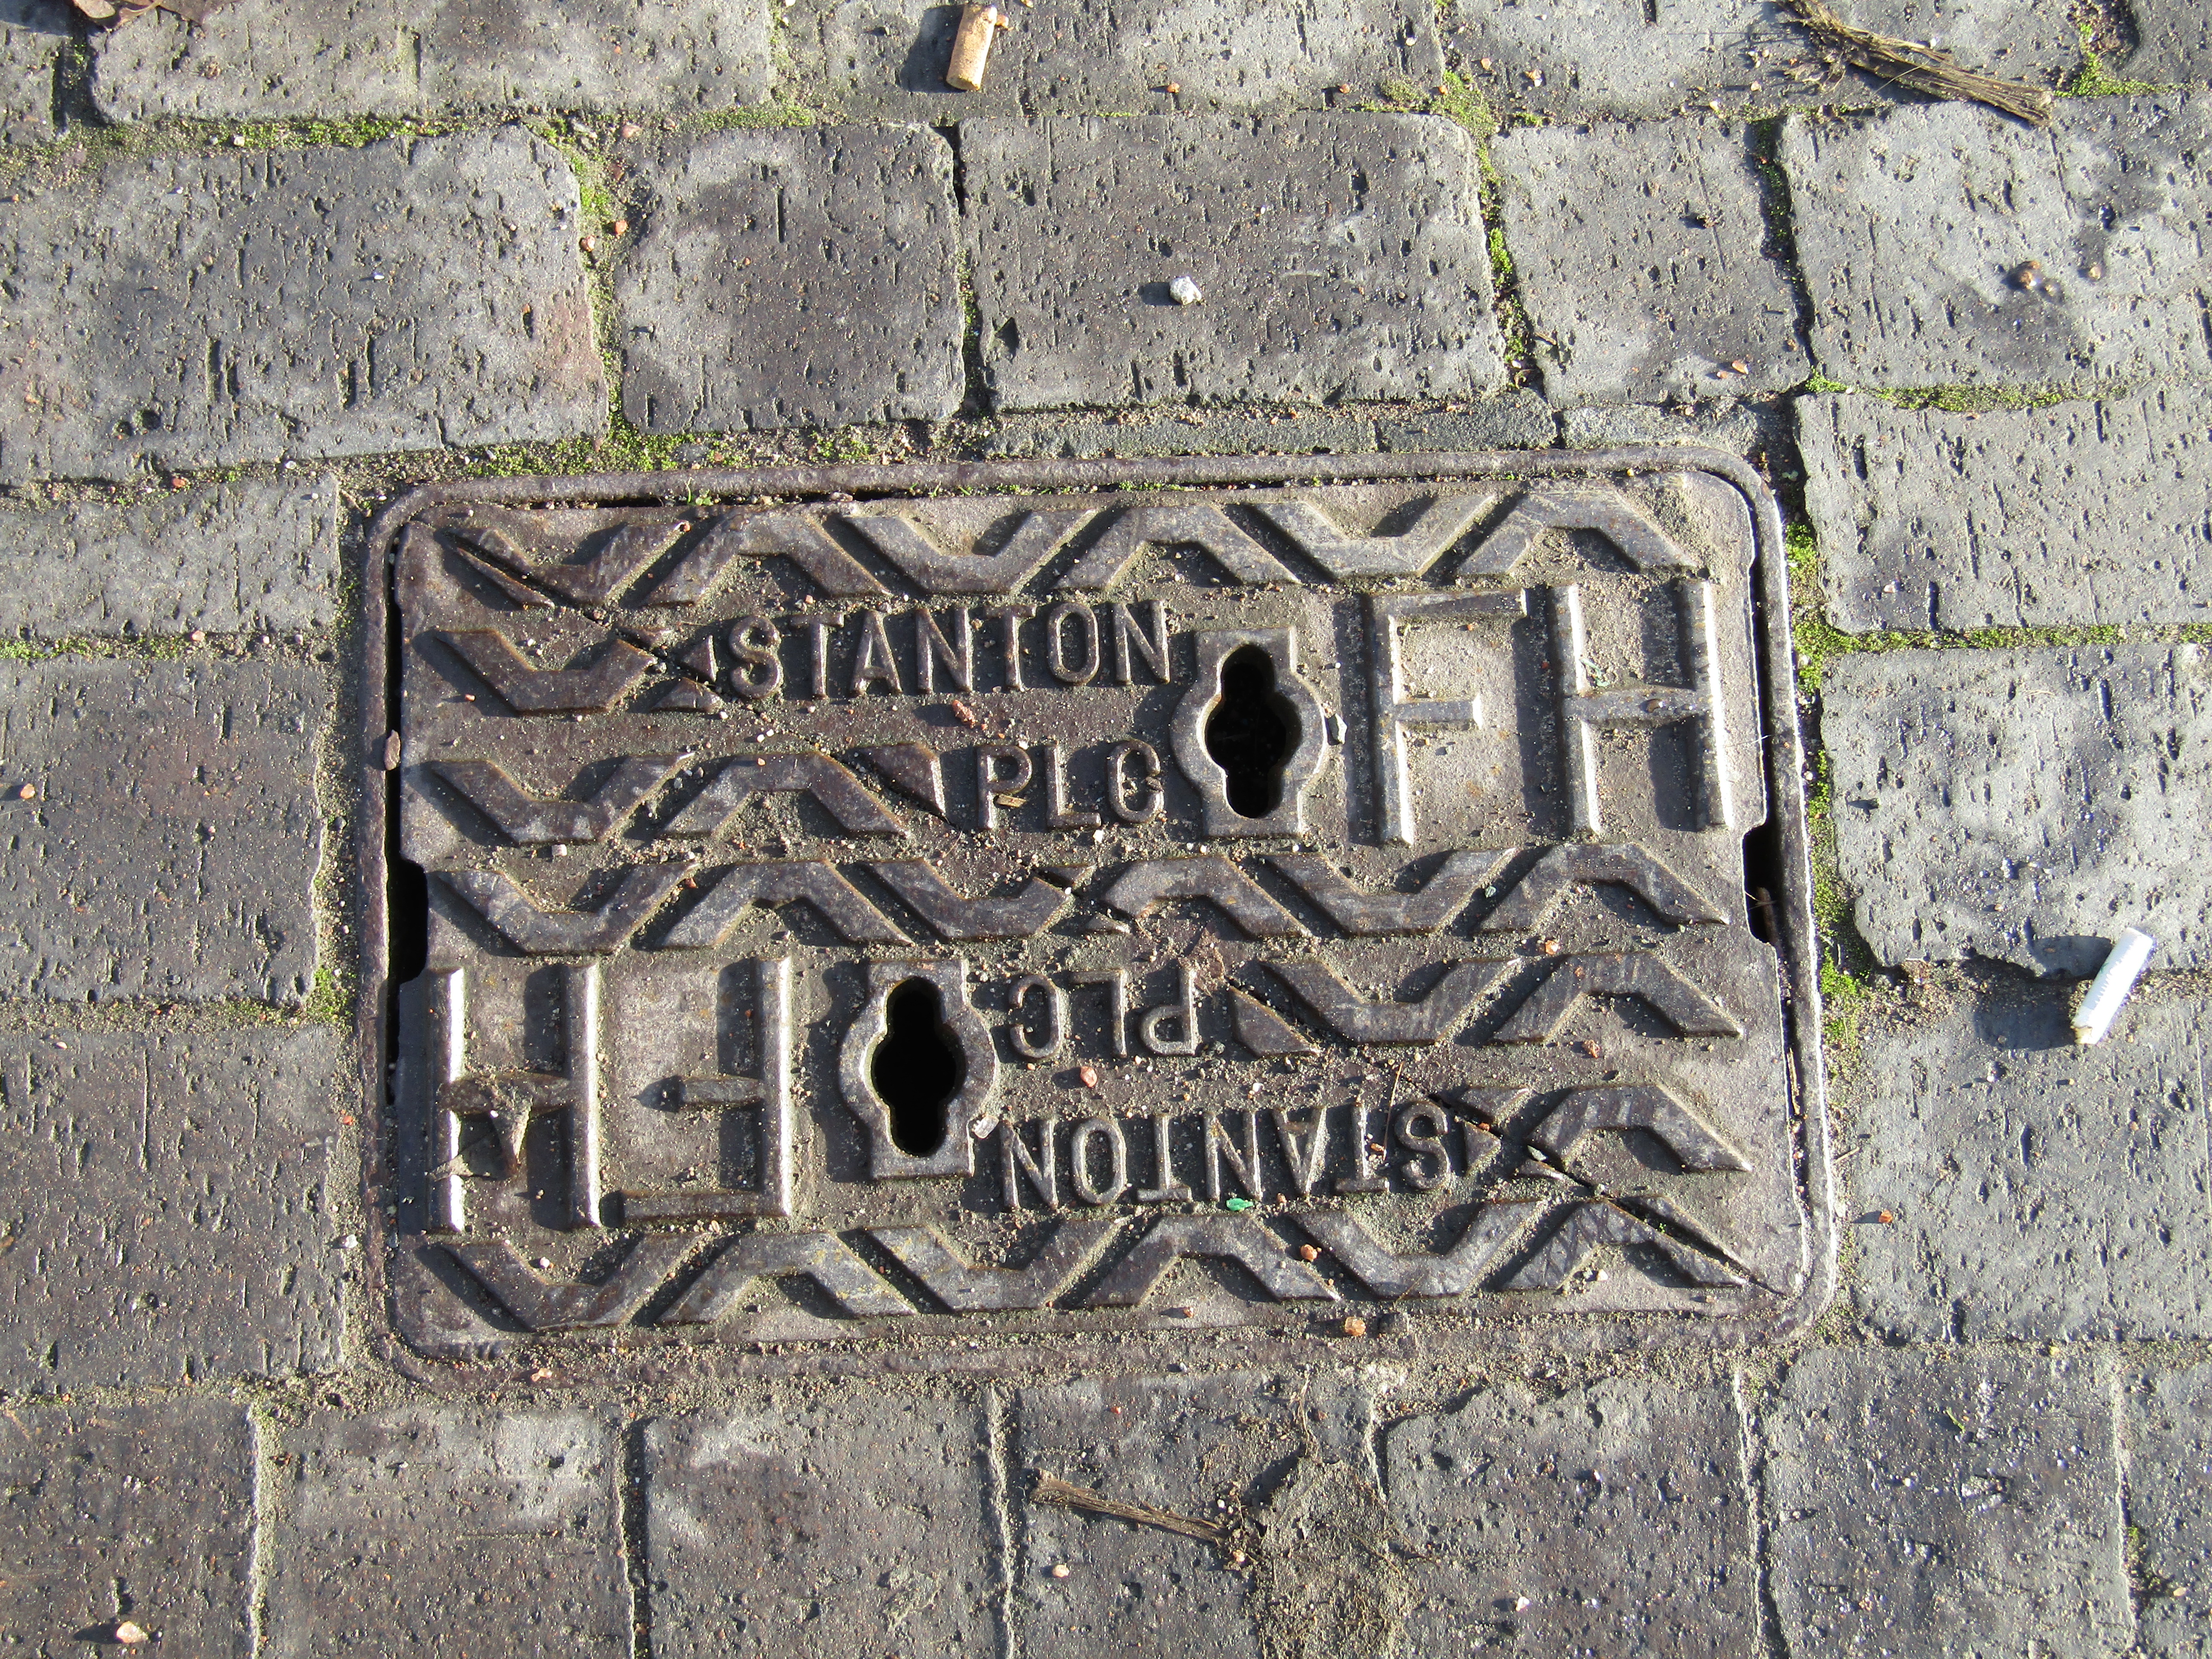
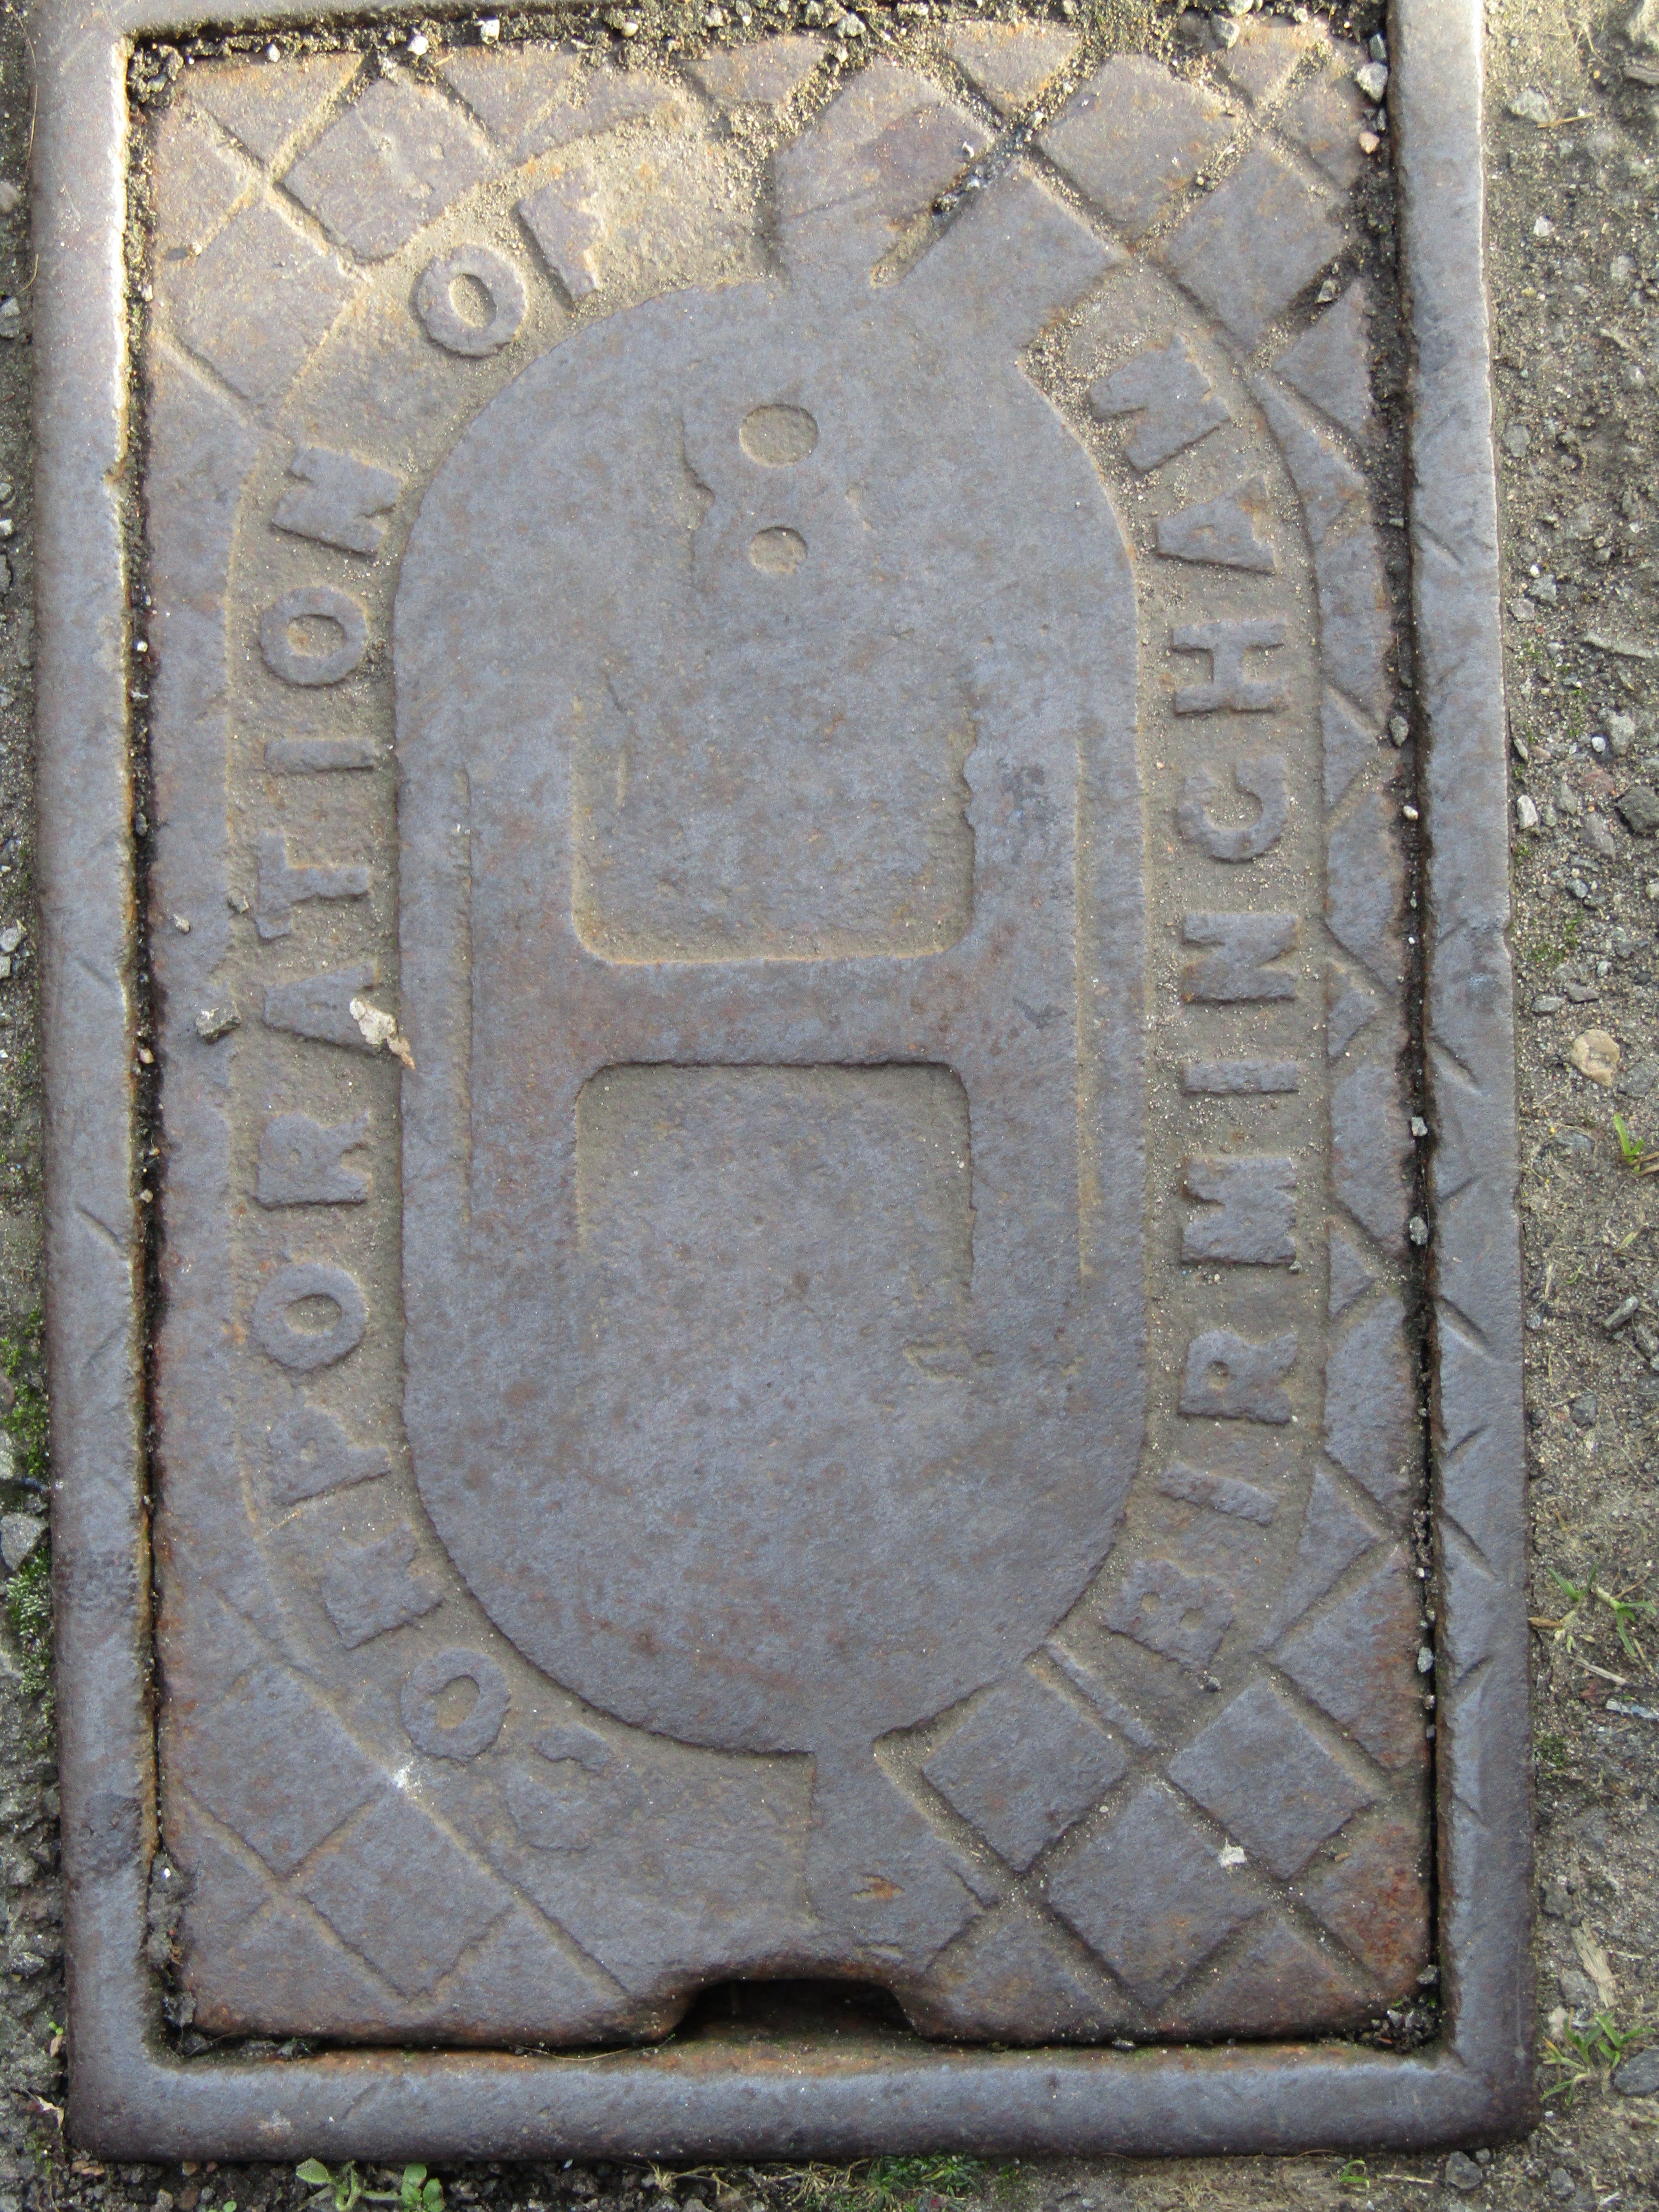
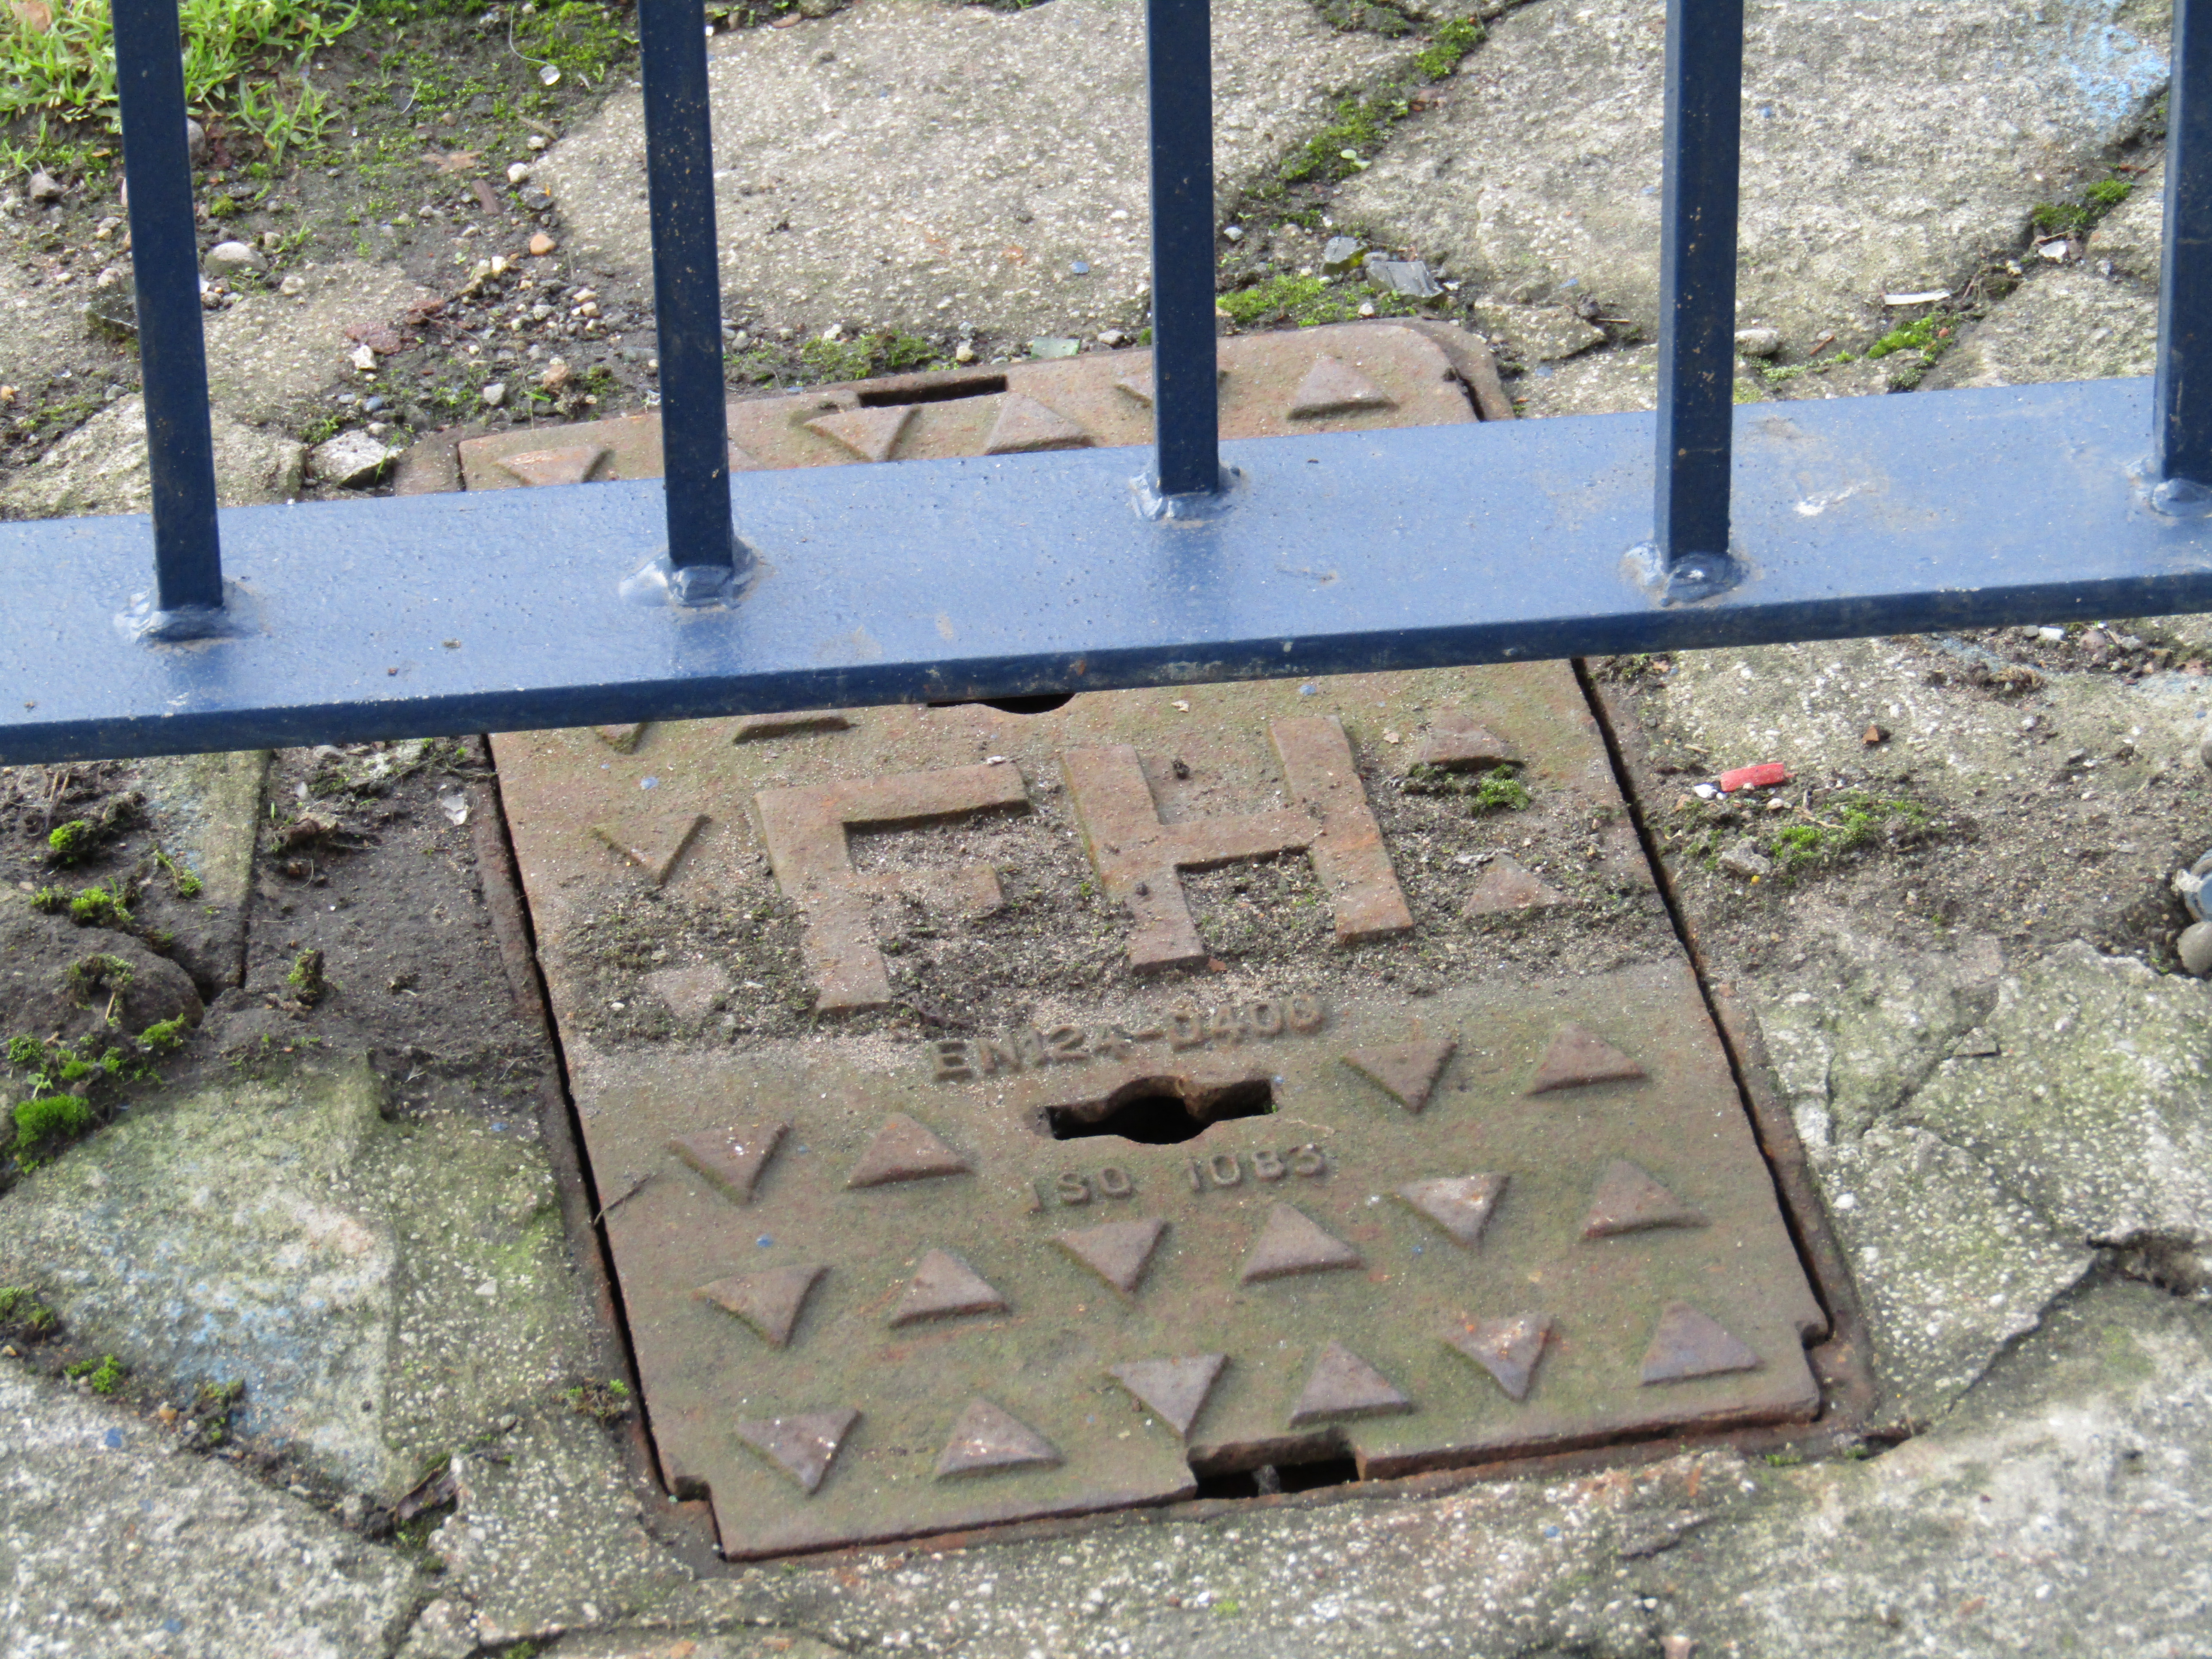
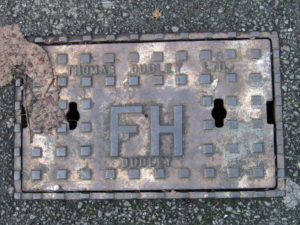
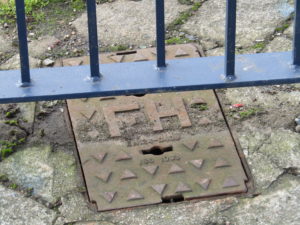
So you have to on the lookout on the ground as well as spotting yellow H  signs.Fire hydrant covers generally have FH on them to identify them, although some older ones can have just H only. Whether the older style ones are still operational I don’t know, but they get mapped anyway.


And of course it’s always good to see public organisations collaborating successfully with each other!

The basic tag is emergency=fire_hydrant with more details on the OSM wiki

Why the sudden interest in fire hydrants? In the UK, they’ve languished as an item that gets mapped.

At our last mappamercia pub meeting Andy Mabbett regaled us with his saga of trying to get West Midlands Fire Service to release the locations of fire hydrants under Freedom of Information legislation.

The full saga can be found here

WMFS refused to release the information on the grounds of national security viz: “publishing information about water  networks and other parts of the critical national infrastructure could  expose vulnerabilities in the network and pose a serious risk to public health either through non availability of water resource or
contamination of supplies. There does not have to be any evidence that this is being planned but it is a possibility given the current threat level in the United Kingdom.”

An appeal by Andy against WMFS to the first-tier information rights tribunal mainly on the grounds that other Fire Services in the UK had already released their information on fire hydrants was rejected. The judges agreed with the Information Commissioner’s Office (ICO) assessment:

“The ICO concluded that the withholding of the information was reasonably necessary for national security and a listing of hydrants and their locations would assist in the planning of an attack by poisoning on water supply infrastructure by identifying access points. Such an attack on the infrastructure would be in the domain of national security. While hydrants are visible a comprehensive list of the precise location of every hydrant would place in the public domain more information than is available through hydrants being visible. WMFS supplied a list of attacks and attempted attacks on water supplies.The ICO considered that such an attack was plausible.”

There is a method for contaminating the water supply known as backflow contamination, which is considered to be reasonably easy according to an excellent paper here which quotes extensively from US military and homeland security sources. Fire hydrants are one possible source to generate backflow.

My limited understanding of water networks is that backflow is a general problem for the water supply industry, which can mitigate the effects with backflow prevention devices. Just how extensive and successful this mitigation is in the UK (and thus how safe we are from backflow attacks) will remain a commercial mystery, as our water supply is in the hands of private companies who are under no obligation to reveal such information. ( I have another story about water networks and open information which will be the subject of a later blog)

Given the cult of secrecy that exists at all levels of official Britain, it also seems unlikely there will be any disclosure of the risk levels of such an attack vector so that we might make up our own minds based on the data. We will have to make do with the assurances of “those that know best”. The public’s role seems to be limited primarily to that of potential or actual victims.

This issue does raise some interesting ethical challenges for OpenStreetMap as it seems to be sending us back several centuries when accurate maps were regarded as military secrets. Or to the days of the Cold War when our national mapping agency the Ordnance Survey would obligingly leave blank spaces on their maps at the sites of military installations. Would a map of fire hydrants in the West Midlands be construed as offence under ss57&58 of the Terrorism Act 2000: collecting, possessing or making a record of information of a kind likely to be useful to a person committing or preparing an act of terrorism? Should we be standing up for opendata, one of the founding principles of OpenStreetMap, or protecting  (supposedly) national security? What is the position in other jurisdictions where there are more draconian restrictions about identifying and mapping military installations and “national critical infrastructure”? Are mappers more circumspect there?  What’s the legal postion- is the OSMF liable for prosecution or just the contributing mapper or both? Should OSMF comply with a demand to remove information on the grounds of national security? Or to refrain from collecting it in the first instance?

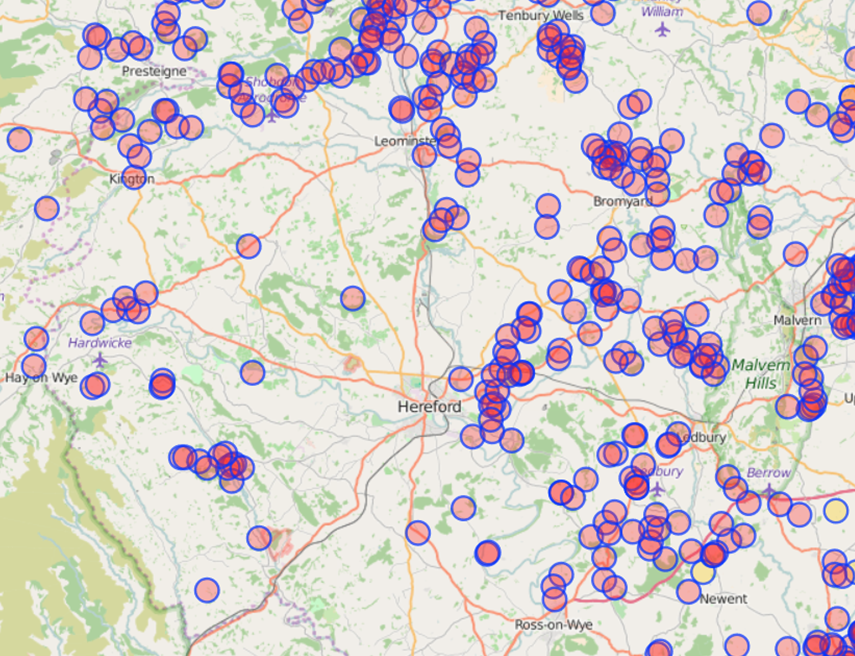
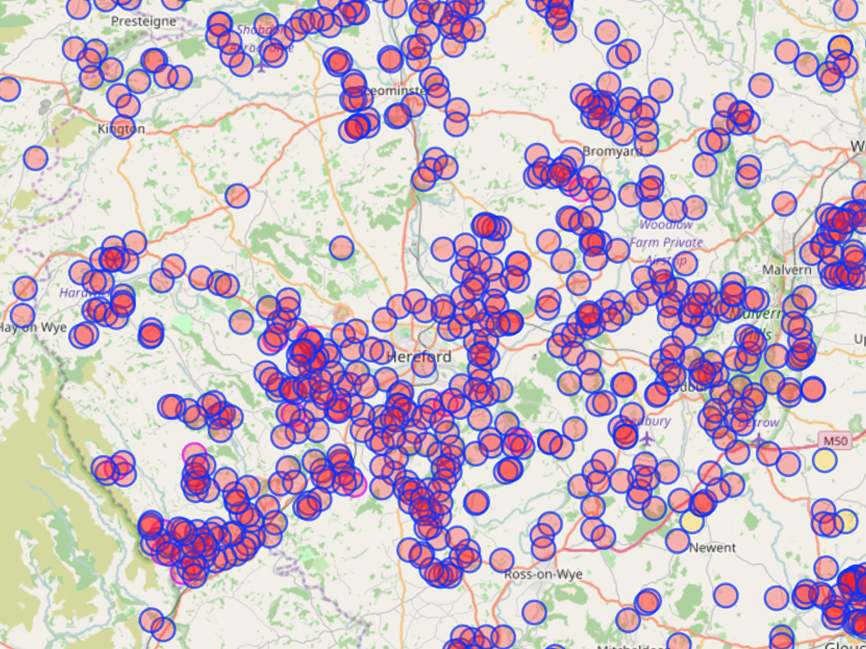
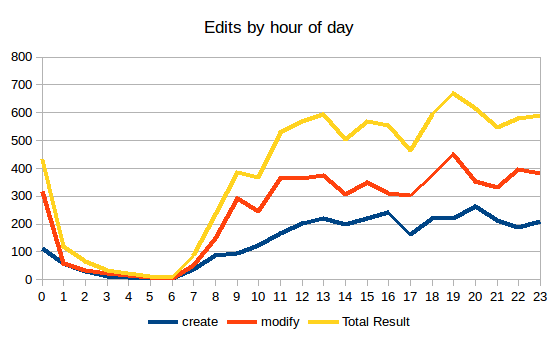
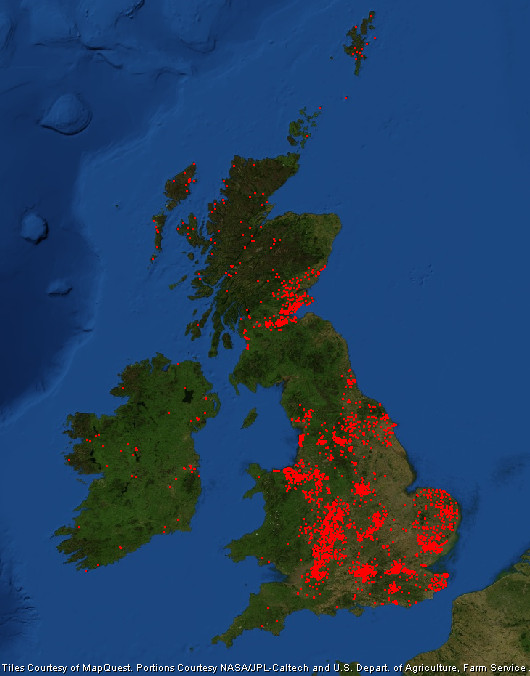
According to taginfo there are only 1786 fire hydrants mapped in the UK, of which there are now about 300  in the West Midlands. Prior to my interest being piqued by this sorry tale there were only about 5 fire hydrants mapped in the West Midlands. Judging by the density of fire hydrants I’ve discovered so far, there are probably thousands in the West Midlands so I seriously doubt whether we’ll ever crowdsource the location of all of them,(or even many more than we have already).

Nonetheless, it’s been an education in another aspect of urban infrastructure I wasn’t really aware of, and a confirmation of the patrician “you don’t need to know about that” attitude of much of British officialdom.

(all of the images are my own and are published here as public domain)

.

Summary of the Summer UK Quarterly Project

Our Summer project  which ended on 30 September was to map as many farmyards as we could.
1. We added 1499 farmyards, which compares to an increase of 853 schools for the schools project which seems to suggest farmyards was a more active project, but the schools project added 3653 polygons( i.e we converted lots of nodes to polygons, thereby enriching the data). So this time we created more data, rather than improve existing data.
2. We gathered momentum during the project: it took 39 days to edit the first 500 farmyards; 33 for the next 500; and 20 days for the ultimate 500 (well, 499)

3. There are over 19,000 place=farm tags, almost all of them (>18,000) nodes. Mostly they seem to indicate farms but sometimes they get used too enthusiastically for any group of buildings. It is generally agreed that this tag really doesn’t add any useful information and its use should be discouraged.

4. We have 36 generically named Poultry Farm or Poultry Houses copied from OS OpenData, which describes the farm but doesn’t actually name it!

5. A lot of farms in Herefordshire (which is where I mapped mostly for this project) don’t have the word Farm in their name. Is this the case elsewhere?

6. If Herefordshire is anything to go by road alignment in rural areas can be pretty poor.

7. Waterways traced from NPE are severely misaligned.

8. 5 and 6 might suggest themselves as future quarterly projects. Correcting them around farms I added certainly slowed down my output.

9. Don’t ask farmers to help you mapping during their busiest time of year! I got zero response from my approaches.

10. Most unusual name I found was Cold Comfort Farm. There are 4 of them in the UK and had a comic novel named after them

Herefordshire farmyards before and after:

hereford-farms-june hereford-end-sep

Colonisation by street cabinet

posted in: Observations | 0

Man_made=street_cabinet is not the most popular tag or object to map: there are only 753 instances in the UK according to taginfo.

However ……they are proliferating at what seems a high rate judging by my recent surveys. I started noticing street cabinets as part of a traffic management project which Birmingham City Council invited OSM to design a tagging scheme for  traffic sensors associated with controlling traffic signals and assist in editing and quality control (more on this later, but probably after SotM 2016, where it will feature in a talk I’ll be giving)

Even if you don’t have a local project like this, traffic signal cabinets usually have  a reference number on them to identify a set of signals and are useful for identifying them. For our project the reference number matched the sensor node  reference number on the traffic management network – so it was a useful way of OSM  mappers on the ground cross-checking centra data held by the Council. Who knows, if you map enough of them in your area, someone will find a use for the data?

By the way  individual traffic signal poles can also have reference numbers, but I’m not advocating they all get mapped!

But back to proliferating street cabinets- always communications cabinets adjacent to phone masts. Not only are they proliferating – they’re growing in size. Some are now the size of refigerators. The  collection shown here was definitely not there when I first surveyed this phone mast several years ago. The smallest one second from the left was all that was there. I guess the proliferation is down to the phenomenal growth in mobile data traffic, and possibly the sharing of masts by mobile network providers. I have seen one surrounded by 7 such cabinets! Can anyone beat that?

street cabinets

Should we bother mapping these? It’s down to individual preference I guess, OSM is not going to be deficient without them.

Perhaps when they become covered in graffiti and are transformed into tourism=artwork? The local taggers have already made a start on these.

But they are a significant physical presence and we do map other objects which are much smaller (most of which, it has to be said, are immediately useful, like benches, mailboxes, litter bins etc). I shall periodically amuse myself by adding significant clusters of these to OSM data.

The things you notice once you start surveying and editing with OSM!

Visit to the National Library of Scotland

posted in: Observations | 0

Last October I had the pleasure of visiting the National Library of Scotland. I was up in Edinburgh at State of the Map Scotland and couldn’t pass up on the opportunity to have a guided tour of the library’s maps reading room. Our host, Chris Fleet, had laid out a number of fantastic items from their collection – each with it’s own story.

Being a bit of a map geek I took way too many photos during the hour or so we had before closure. Here are some of the best to whet your appetite. The NLS are long term supporters of OpenStreetMap, have scanned and georeferenced many thousands of maps, and host zoomable maps on their amazing website. If you find yourself in Edinburgh, be sure to check out their collection.

Russian military maps (read all about these secret cold war maps).
Russian military maps (link: secret cold war maps).
Textured maps for the blind and partially sighted.
The Blaeu Atlas of Scotland, 1654 (view online)
Precision tools of the map maker.
Map corrections: tracing paper and sticky tape!
A map of WW1 trench positions in Belgium.
Now you see it, now you don't. Early day 'airbrusing' to remove an airfield from aerial photos.
Now you see it, now you don’t. Early day ‘airbrusing’ to remove an airfield from aerial photos.

Schools project: When we map

posted in: Observations, Participate | 0

In order to assist a conversation on Loomio about when to hold a “Night School” mapathon, I took a look at when mappers are most involved in the quarterly project to map schools. Data is based on Harry Wood’s School Edits website.

Starting with average number of mappers per day we see that Wednesday leads, whilst Friday and Saturday have the lowest number of mappers. Nothing unusual here then!

WhenMap_Day

Although Monday has fewer mappers, in terms of total edits it is still up there with Tuesday and Wednesday.WhenMap_Day2

If we look at the time of day we find that 19:00 is the best hour for mappers.

WhenMap_Hour

UK mapping hot-spots

posted in: Observations, Participate | 1

It’s been a month since we started our fifth quarterly project, so let’s look at where the engaged OpenStreetMap contributors are editing. Read on to find out where the mapping hot-spots are and where we have missing map locations.

Each quarter year we pick a different task to work on. The fifth is all about schools and has (by a long way) been our most successful. Let’s therefore use it to get an idea of where the engaged OpenStreetMap community is. By “engaged” I mean, where are the UK OpenStreetMappers who follow the community channels – such as the talk-gb mailing list and twitter accounts like ours – and join in with group mapping efforts.

Lets look at the results. Data comes from the school edit tracker.

Map of the OpenStreetMap community engaged in the quarterly project to map schools.

As you’d expect most edits are focused on large towns and cities. Here we have a larger population from which to attract engaged mappers, and of course there are more schools to map without having to travel so far. Large cities don’t always equate to lots of mappers though. Manchester and Liverpool are lagging behind; a trait we also saw during our first quarterly project (note: edits in the OL postcode region are my remote edits).

The cities that are most engaged also tend to be those with OpenStreetMap communities that meet regularly.

Perhaps big urban areas seem to daunting to an individual mapper! What we see is that the cities and  larger towns that are most engaged also tend to be those with OpenStreetMap communities that meet in person regularly. These include Birmingham (this group), London, Nottingham and the central belt of Scotland. Perhaps the active mappers in Blackpool and Bradford could see if there is any interest in setting up a local community focused along the Mersey!

Other areas that are doing well are Cheshire, East Anglia, the South East and along the River Severn. Within the more rural areas Yorkshire is doing well (mapping is across the county not just in the larger urban areas) and as previously noted the Outer Hebrides and Shetland Islands.

Cardiff is another example of a city that is missing mappers. As are most of Wales and the South West, much of which is rural. They are joined by the region sandwiched between the Lake District and Edinburgh.

Finally, Ireland’s mappers are focused on mapping Townlands, but nevertheless they’ve found time to map a few schools in both Northern Ireland and the Republic of Ireland.

Birmingham New Street Station

Surveying and editing the new  mainline multilevel station in Birmingham proved to be a mapping challenge; involving as it did keeping a lot of the existing edits, modifying most of them and then layering on the new developments. Very similar in mapping terms  to the physical work in actually renovating the stations whilst keeping it running.

The mapping is complete apart from a few pernickety errors, omissions and problems like the late completions of the taxi rank to the South of the station and the Metro Station to the North. The main improvement needed is  smoothing the curves of the platforms and  tracks. Getting them aligned to the lifts, escalators and stairs from the concourse above was bad enough!

One thing I haven’t been able to address is the  goods delivery access to the shopping mall above the station. Previously there was a service road on the roof  for delivery which was accessed via the ramp to the multistorey car park, but most of the roof is now a huge glassed dome. If anyone knows how it’s done please let me know.

The rendering limitations of OpenStreetMap meant some compromises were in order: mainly the prominence given to the pedestrian way for the Grand Central shopping mall as opposed to the pedestrian concourse underneath for the station concourse. Tagging the mall pedestrian ways as bridges was a possibility but that was really too much mapping for the renderer and not what’s on the ground.

To rectify this inability to render multiple layers, I thought I’d produce some floor plans of each level, selecting in JOSM layers various tagged levels. They’re only screenshots from JOSM as my  mapping skills don’t extend to taking the data and rendering as a map- and it would just take too long to learn. If anyone else wants to have a go then please feel free! I’ve produced two versions of each, one with a dark background and one with a light background. I have done some post-editing to make the concourse more prominent rather than relying solely on the footways in the original OSM data. The plans  may prove to be more useful separated like this than trying to interpret the complexity of the standard OSM map.

First New Street Station Concourse (at level 0)

New Street Station Concourse 4 New Street Station Concourse 3

Next the platforms underneath (at level -1)

New Street platforms 2New Street Platforms 1

Grand Central shopping mall (above the Concourse at Level 1)

Grand Central 2 Grand Central 1

And finally Level 2

New Street Sation Level 2 2 New Street Station Level 2

Some of these plans might make it to our mappa-mercia maps section, as a regional resource.

A few suggestions for improvements  in rendering complex public buildings like this:

  1. Display an icon and name for the entrances
  2. Display an icon for emergency exits
  3. Differentiate rendering for stairs and escalators
  4. Show direction of travel for escalators and stairs
  5. Display an icon for ticket barriers (turnstiles)
  6. Tagging schema for internal concourses and thoroughfares (maybe just add indoors=yes to highway=pedestrian and area=yes)
  7.  Opacity differentiation for multiple concourse/thoroughfare levels (even  just two would be useful)
  8. Specifically for railway stations – get the platform rendering to behave as if it understood OSM layers!

And apologies to anyone involved in indoor mapping – I found the documentation just too complex and confusing, but I’d like to learn. If anyone can review the data and demonstrate how to make a complete 3-D multilayer model I’d be very appreciative.

Birmingham: A top 10 city by the number of POI

posted in: Map Improvements, Observations | 0

Have you ever wondered which cities have the most points of interest (POI) mapped in OpenStreetMap? That’s exactly the question that one user, baditaflorin, pondered over. With 65,093 features on the map, we are delighted that Birmingham ranks as number 9 in the count of most POI.

Head over to baditaflorin’s write-up to find out which city tops the list.

Image from DAKItrack.