Heritage mapping

posted in: Use The Map | 3

Finally, after a couple of years surveying listed buildings, parks and gardens an public artworks, amassing along the way a vast collection of photos; we’ve managed to get a prototype map showing everything of “heritage”  or “cultural” status in the West Midlands.

There doesn’t seem to be anywhere with one source that you can go to to visualise all this data and how each point relates to another. You can search and find individual points which is time consuming and requires some prior knowledge. But once you’ve found an interesting artefact you’re at a loss to know what else is close by, so that if you plan a visit you might miss something just as interesting nearby, or fail to put your chosen artefact into its proper context.

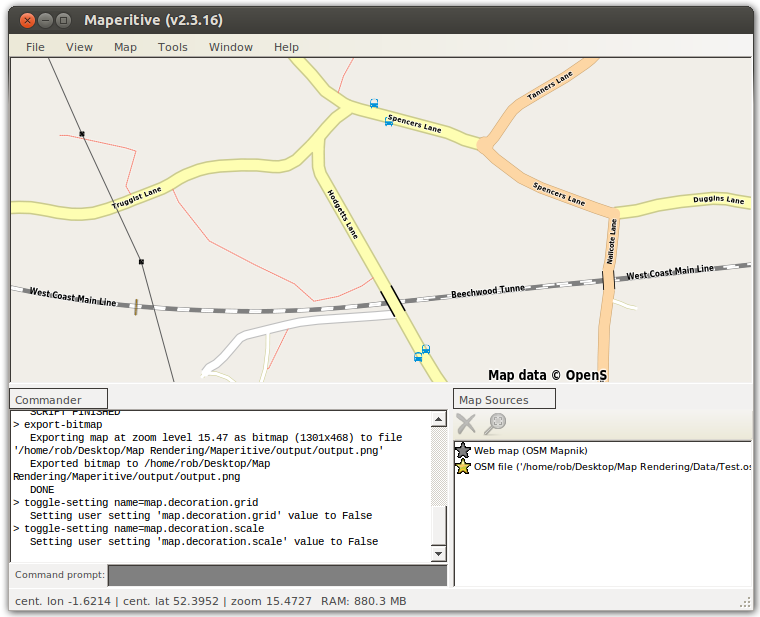
The data is a mixture of OSM data and government data from English Heritage. The English Heritage data is what we’ve come to expect from government data – it’s about 95% accurate and about 95% complete (not a mathematical analysis just a “feel” for the data based on errors discovered so far). Getting that last 5% just seems to be too much effort and too much expense! But thanks anyway to English Heritage for finally publishing the data under an open licence.  OSM data was extracted using osmfilter and then converted to csv format using osmconvert -two very useful tools, even if getting used to a command line interface was a bit tedious at first – so congratulations to the authors.

We’ve used TileMill and MapBox mainly because of the excellent initial free hosting and the ease of learning the editing tools – still a steep learning curve but nowhere near as steep as some map-making tools. TileMill has its limitations but it’s a great introduction to keen mappers who are not skilled software developers. So congratulations to MapBox and don’t worry about it looking daunting once you’ve started:  their support is excellent and not at all condescending to newbies.

This is what it looks like and you find the service here.

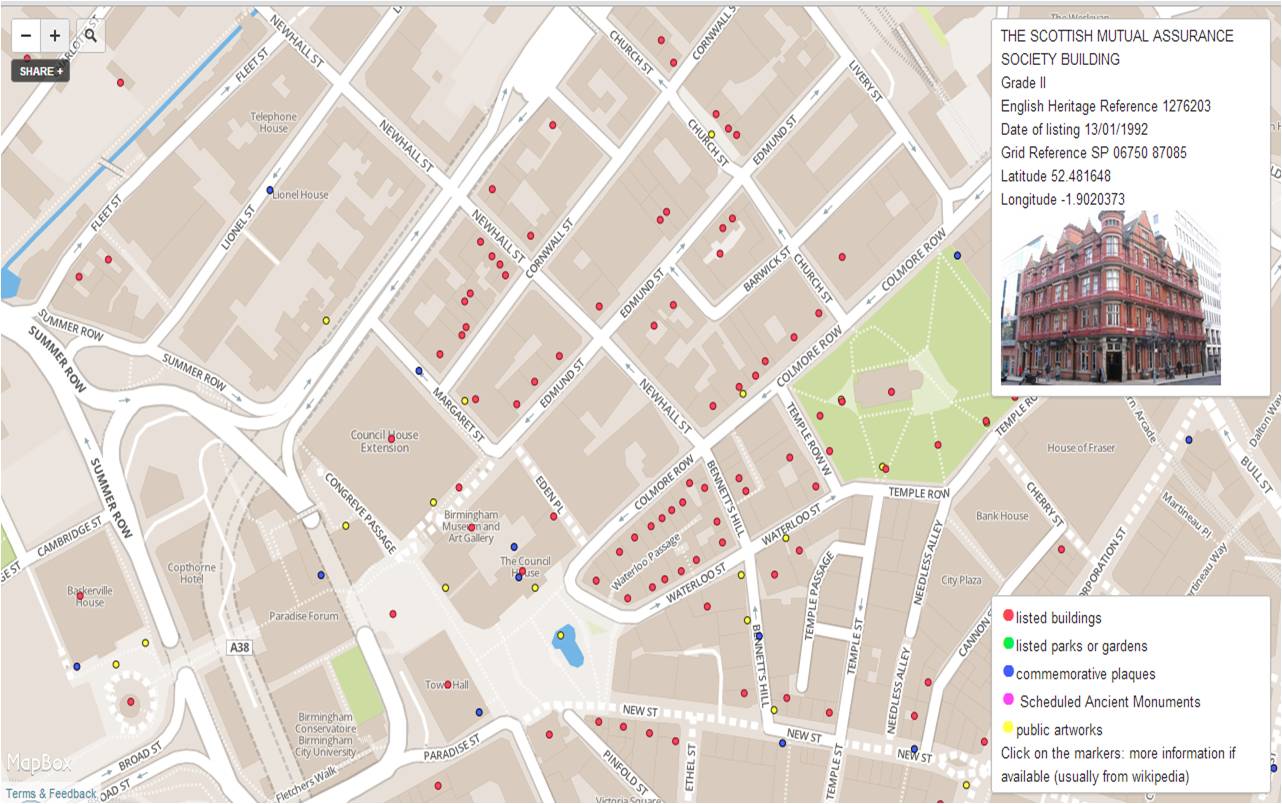
Our service is still evolving and is nowhere near fully populated – most interesting feedback so far is the level of satisfaction with the pop-up boxes being set to the side of the map not over the marker, obscuring the surrounding area. We’re hoping to get local conservation bodies interested and one has already responded positively.

Maperitive: My first map render

posted in: Use The Map | 2

When I introduce someone new to OpenStreetMap I often get asked how is it different from alternatives, such as Google Maps. One of the key differences is that our map data is supplied and incorporated by 1000s of volunteers, each one passionate about their local community or area of expertise. This means that our data is often rich in local knowledge, and is also frequently updated (as seen in speed by which the Humanitarian OpenStreetMap Team respond to changes caused natural disasters).

All this map data is fantastic, but if you cannot present it in the way you require, then you might as well not have it in the first place. This leads me to a second difference between OSM and other alternatives; namely all the underlying data is available to download and use for free. If you are not happy with the way the map looks, then you can you can use the data to create your own map. In this blog post, I introduce one such tool – Maperitive.

Question: What is Maperitive?

“Maperitive is a desktop application that renders maps in real time using OSM and other sources of data.” In essence we provide Maperitive with raw map data and a set of instructions describing how we would like the data to be displayed, and it draws (or renders) us a map.

Question: How to download and install?

There is no installation process as such. Simply download the latest version of the Maperitive zip file from http://maperitive.net/download/,  unzip it into a directory of your choosing, and run it by double-click on maperitive.exe. (For non-Windows OS’s installation instructions can be found here).

Screenshot of Maperitive

Question: I’ve downloaded and opened Maperitive, what am I looking at?

The user interface for Maperitive comprises of 4 parts. The majority of the window is taken up by the Map Area. By default this will be showing the standard OSM Map, or “Web Map” as can be seen in the Map Sources list in the bottom right hand corner. As we add more data this will appear in this list. The map can be moved by clicking and dragging, and zoomed by pressing the + and – keyboard keys (or using a mouse scroll-wheel).

At the top is the Menu Bar with drop down menus (File, View, etc..). Finally, in the bottom left is the Commander. Here we can enter instructions in the command prompt, however to keep things simple, we will only be using the Menu Bar to issue instructions in this blog post.

Question: How do I render my own map?

Before we can render a map, we must first get some map data. There are many ways to get OpenStreetMap data (we will explore these in a later blog post), including through Maperitive itself. For now we will use the OpenStreetMap.org website. Load the website and move to an area you are interested in. To download the data simply click “Export” and select “OpenStreetMap XML Data” as the download format.

Once you have downloaded some OSM data lets get Maperitive to render it. Start by clicking the star next to “Web Map” in the Map Sources list. This switches off the default map and the Map Areashould become a blank canvas ready for us to render a map. To do this open the downloaded map data using File->Open Map Sources…. Congratulations you have rendered your first map! By default the map will look very similar to the standard OSM map. We can however change this by selecting a different set of “rendering rules”. Try the different rules by selecting them using Map->Switch To Rules.

In a following blog post we will explore how to create your own rendering rules, and therefore customise your map to your liking. But for now lets finish by exporting the map to a PNG image. Choose Tools->Export To Bitmap. The location in which the image file was saved is shown at the bottom left, as the final line in the Commander.

Mapping transverse steps

posted in: Observations, Participate | 3

How do you map steps that are transverse like these? This is a view towards Birmingham Central Library from Victoria Square and is a route traversed by thousands of people a day.

Currently highway=steps is for a set of steps along a linear way which doesn’t address this scenario which must occur tens of thousands of times across the planet.

There is a tagging proposal which as been around for a couple of years which seems to be going nowhere. I’ve read it and it’s far too complex for  me and I would guess most mappers.

Solving this problem is important a) for accurate mapping and  b) for disabled/visually impaired routing.

Perhaps a simple tagging scheme of highway=steps steps=transverse with the left hand side of the way being the top with a rendering of the current steps render with little arrows pointing in the downwards direction across the way?

While we’re at it perhaps the existing linear steps render could be improved with an arrow indicating down? But maybe that would be confusing with the one way render for streets/roads.