UK mapping hot-spots

posted in: Observations, Participate | 1

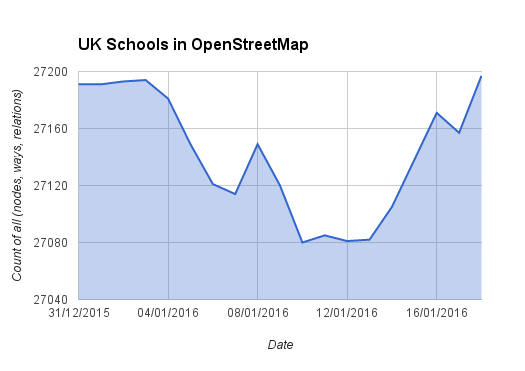
It’s been a month since we started our fifth quarterly project, so let’s look at where the engaged OpenStreetMap contributors are editing. Read on to find out where the mapping hot-spots are and where we have missing map locations.

Each quarter year we pick a different task to work on. The fifth is all about schools and has (by a long way) been our most successful. Let’s therefore use it to get an idea of where the engaged OpenStreetMap community is. By “engaged” I mean, where are the UK OpenStreetMappers who follow the community channels – such as the talk-gb mailing list and twitter accounts like ours – and join in with group mapping efforts.

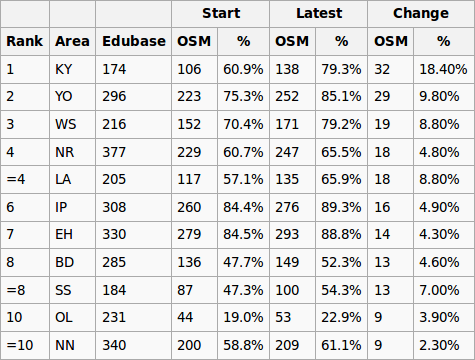
Lets look at the results. Data comes from the school edit tracker.

Map of the OpenStreetMap community engaged in the quarterly project to map schools.

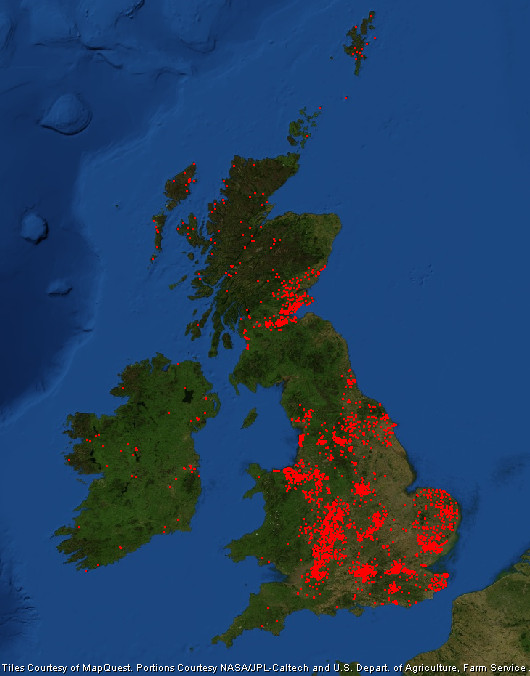
As you’d expect most edits are focused on large towns and cities. Here we have a larger population from which to attract engaged mappers, and of course there are more schools to map without having to travel so far. Large cities don’t always equate to lots of mappers though. Manchester and Liverpool are lagging behind; a trait we also saw during our first quarterly project (note: edits in the OL postcode region are my remote edits).

The cities that are most engaged also tend to be those with OpenStreetMap communities that meet regularly.

Perhaps big urban areas seem to daunting to an individual mapper! What we see is that the cities and  larger towns that are most engaged also tend to be those with OpenStreetMap communities that meet in person regularly. These include Birmingham (this group), London, Nottingham and the central belt of Scotland. Perhaps the active mappers in Blackpool and Bradford could see if there is any interest in setting up a local community focused along the Mersey!

Other areas that are doing well are Cheshire, East Anglia, the South East and along the River Severn. Within the more rural areas Yorkshire is doing well (mapping is across the county not just in the larger urban areas) and as previously noted the Outer Hebrides and Shetland Islands.

Cardiff is another example of a city that is missing mappers. As are most of Wales and the South West, much of which is rural. They are joined by the region sandwiched between the Lake District and Edinburgh.

Finally, Ireland’s mappers are focused on mapping Townlands, but nevertheless they’ve found time to map a few schools in both Northern Ireland and the Republic of Ireland.

Mapped: Every school in the Outer Hebrides and Shetland Islands!

posted in: Map Improvements, Participate | 1

Progress on our fifth OpenStreetMap quarterly project – schools continues to delight. Today we congratulate the HS (Outer Hebrides) and ZE (Shetland Islands) postcodes for becoming the first to reach 100% completeness!

Not even a month in to the latest UK Quarterly Projects and there has already been so much to celebrate. Here are the highlights from the third update on our project to map Schools.

1. HS and ZE are 100% complete!
Yes you read it right! Mapping of schools in the HS (Outer Hebrides) and ZE (Shetland Islands) postcodes are complete thanks to the efforts of OpenStreetMapper seumas. This means that all schools are mapped as a land area at minimum. We continue to add detail (e.g. buildings, sports pitches and paths) to further improve the mapping of the schools. Many other postcodes (most with more schools within them 😉 ) are close to 100% complete now too. Follow the progress here.

Sir E Scott School in in the Outer Hebrides. Image courtesy of Urban Realm.
Sir E Scott School on Tarbert in the Outer Hebrides. Image courtesy of Urban Realm.

2. Open Data Manchester
Following a tweet Open Data Manchester have asked whether anyone can go and show them how to map. Looks like their next meeting is Monday February 1st, 6.30 – 8.30pm. Any volunteers?

3. 175 people have done 5351 edits
Amazing numbers measured by Harry’s tracker. Looks like Uganda has joined the project too. It would be great if  someone could turn the CSV linked data at the bottom of the tracker into a daily chart. Drop us a comment below if you are able to help.

4. Nodes converted to ways
Following lot’s of data clean up we are nearing 80% of schools mapped as land areas rather than simple points. We should hit this in the next couple of days.

5. Northern Ireland still needs some work
If you map in Northern Ireland and want to get involved please do. Each extra school mapped there will help lift it off the bottom of the tracker. We can also look at doing some initiatives in NI if the local community want this. Let us know 🙂

Interested in mapping schools in your area? To join us see here. Never mapped before? No worries, contact us for a helping hand.

“Real Time Mapping” – an update

posted in: Uncategorized | 1

Birmingham City Council is now well into its project to convert many of its streets to a 20 mph speed limit (see previous blog here). We’re receiving regular weekly updates as to what work will be completed in the current week and what work is planned for the upcoming week. These are in fact the internal reports used by the City Council Cabinet to review progress. So, every Friday the map gets updated with new 20 mph maxspeed tags. This map shows which roads have been updated by the contractors. So far we have added 3 weeks’ worth of work

Not quite “real-time” but a significant first step in showing how organisations can use OpenStreetMap to create dynamic up-to-date maps. Thanks are due to Birmingham City Council’s staff in trying something new and co-operating with us.

Schools: Back to square one?

posted in: Map Improvements, Participate | 4

January 1st marked the beginning of our fifth OpenStreetMap quarterly project – schools. After 18 days we return back to square one. So what’s been going on?

The UK Quarterly Projects are intended as a bit of fun designed to inspire a few edits to OpenStreetMap in peoples spare time. Hopefully they also help with the sense of community and attract a few new people to OpenStreetMap. Our fifth project is all about schools.

One of the methods we use to track progress is a daily count of the total number of schools mapped in OpenStreetMap. This is based on the data reported by TagInfo and the data is collected daily thanks to a script written by Adam Hoyle.

UK schools mapped in OpenStreetMap - back to square one?
UK schools mapped in OpenStreetMap – back to square one?

Normally we would expect to see the graph trend upwards, but with the schools project we started with an initial dip, having only just returned to square one. Why?

Well all is not bad. The chart above hides a lot of progress that has been made. Thanks to early work by Frederik and a uMap produced by Jerry, there has been a big focus on improving the mapping of existing schools. In many cases this meant converting a simple node (point marking the centre of the school) to a way (polygon) demarking the boundary of the school. The chart unfortunately misses these! There were also many cases where a school had been marked with both a node and a way. This is considered bad practice and the drop in the chart reflects how people have been cleaning this up.

We see that a hugely impressive 137 people have been helping to map schools in OpenStreetMap, editing a total of 3,300 schools!

So what progress has been made? To answer this we can refer to a number of new progress trackers. Firstly Harry Wood‘s school edit tracker. This counts the number of UK school edits that have been made. We see that a hugely impressive 137 people have been helping to map schools in OpenStreetMap, editing a total of 3,300 schools! For fun Harry’s tool also provides a leader board – congratulations to Robert W, Paul (southglos) and Mark S for taking 1st, 2nd and 3rd respectively.

We can also track progress by postcode region thanks to Robert W’s comparison tool. In my previous post we looked at how the KY postcode area was leading the way. Overall we have now increased the number of schools mapped in OpenStreetMap from 62% to 68% (excludes Northern Ireland data as this was added later). If we continue at this rate we will reach a massive 90% by the end of the quarter. I think we can get closer to 100% as the pace will pick up now that the initial clean up of existing data is coming to an end. 🙂

Up for the challenge? To join us in adding schools to OpenStreetMap see here. Never mapped before? No worries, contact us for a helping hand.


Kirkcaldy postcode leads the way

posted in: Uncategorized | 0

It has been amazing to see the level of activity for the fifth OpenStreetMap UK quarterly project – schools. So far nearly 300 schools have been mapped or improved by 22 people. The Kirkcaldy postal area – KY – leads the way with over 30 schools mapped.

At just 10 days in, the community of mappers have:

  • created a number of amazing tools to help identify missing or incorrectly mapped schools;
  • agreed on new tags to allow us to reference the English Edubase and Scottish Executive Education Department data; and
  • made massive progress on mapping.

So which area is leading the rest? Based on Robert W’s comparison tool, here are the top 10 most improved postal areas. This is measured by the increase in OpenStreetMap objects that “match” the government data between 2016-01-05 and 2016-01-10. Other measures are of course possible and may show a different picture.

KY leads the way in our list of top 10 most improved regions.

Well done to the Kirkcaldy postcode area, KY, for heading up our leadership board. Great work!

There is still plenty of time to get involved with adding schools to OpenStreetMap, the worlds largest crowd-sourced and most up to date map. A list of useful resources can be found here. Not sure how to map? No worries. Check out our tutorials, get in contact with us, or if you are in the West Midlands why not pop along to our next social and find out how.


Towards a real-time map?

posted in: Map Improvements | 1

Birmingham City Council has started rolling out a speed limit reduction on many residential roads and in some local centres to 20mph. This presents a great opportunity for local OpenStreetMap mappers to demonstrate the power of OpenStreetMap in keeping pace with the speed limit reduction programme as it progresses.

Phase 1 covers parts of central, south and east Birmingham. The scheme will install signs and lines only – no new traffic calming (e.g. speed bumps) will be introduced as part of this scheme. Road signs and markings will be installed from December 2015 to March 2016 and the speed limit will come into effect once works are complete.

20mph is part of a broader package of measures aimed to give people, especially children, more confidence to walk and cycle. Over the next 5 years the Council intends to put 20mph speed limits on 90% of Birmingham’s roads. Most main roads will keep their existing 30mph or 40mph speed limits.

20 mph zones are starting to be rolled out across Birmingham and we are keeping OpenStreetMap up to date.

According to Council consultation in the areas covered, 49 per cent of people were in favour of 20mph limits and 35 per cent opposed. Council data show that the minor roads (mainly residential) in this particular scheme were the location for 508 casualties, including 68 deaths or serious injuries between 2011 and 2013. That is roughly one casualty every two days.

OpenStreetMap locally has worked with Birmingham City Council Transportation over the past year to understand how we could achieve a “realtime mapping” of the changes.

The Council estimate related annual costs from injuries, hospital and ambulance services, would reduce by up to £870,000. The total cost is £1.025m, with almost 80 per cent coming from a Department for Transport grant to encourage cycling.

OpenStreetMap locally has worked with Birmingham City Council Transportation over the past year to understand how we could achieve a “realtime mapping” of the changes. They have provided a suitable opendata shapefile of all the roads affected and we have access to weekly project reports on works scheduled and completed, so we should be able to reflect the changes as they take place. Not quite “realtime” but a huge step towards it. It’s taken a deal of persistence on our part, but once we secured some internal sponsors, things moved forward consistently.

We’re still to decide how best to display all this but we have a map of the project’s scope and will also be using ITOWorld’s speed limit map.

Although the Traffic Regulation Order enacting the new legal speed limit doesn’t come into force until the project is completed, the signs will be visible. On the basis that we map what is visible we will be adding 20mph tags as work progresses. Whilst we’ll be reliant largely on progress reports from the Council, there are sure to be some sightings as we move around the affected areas.

2016 first quarterly project: schools

Happy New Year! (and Happy New Mapping Year!) The first Quarterly Project for 2016 is now under way and is Schools. There are really two strands to this project.

The first is to remotely (armchai)r map and get an increase in coverage of the number of schools

The latest government data is for January 2012 which shows 24,372 schools in England (including nursery schools, state-funded primary schools, state-funded secondary schools, special schools, pupil referral units and independent schools.)

For Wales that data is from January 2015 : 13 Nursery Schools; 1,330 primary schools;6 middle schools;207 secondary schools;and 37 special schools.

For Scotland data is from September2011 and shows 2,553 pre-schools, 2,081 primary schools, 367 secondary schools and 158 special schools.

For Northern Ireland data is from October 2015 and shows 96 nursery schools; 827 primary schools; 202 secondary schools and 39 special schools. Additionally there are 14 independent schools and 1 hospital school.

That gives a total of 32,318 schools. Taginfo shows 27,191 schools which is 84.1% coverage in OSM. However 6,348 are represented as nodes only. It would be great to have these as polygons and associated buildings. It would also be great to have close to 100% coverage.

This data comes from a cursory web search. If anyone has better or newer data, it’s welcome.

Schools can be remotely mapped (armchair mapping) by using Ordnance Survey OpenData StreetView(OSSV) data where school buildings are individually identified (but not always named). This data needs to be cross-checked with Bing aerial imagery which can often show OSSV schools as either having been demolished with a resultant brownfield site or housing redevelopment, or with buildings having been demolished and rebuilt in a new configuration. Often where a school site has ceased to exist, a completely new school site has been constructed nearby.

The second strand is for those who prefer surveying: existing school names change (e.g change to Academy Status, amalgamations); there will schools in OSM with no name, and with the advent of free schools, new ones will be appearing constantly.

So there’s plenty to do over the next few months!

There’s a progress table already established. You’ll need to access the sheet marked Schools.