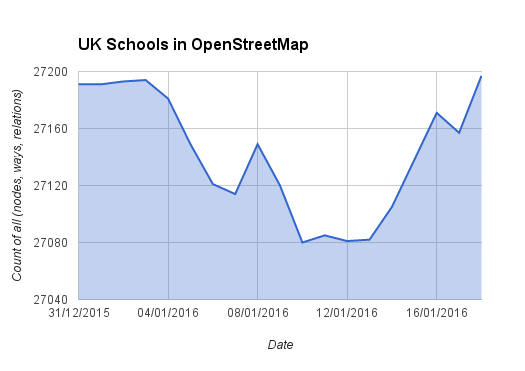
January 1st marked the beginning of our fifth OpenStreetMap quarterly project – schools. After 18 days we return back to square one. So what’s been going on?
The UK Quarterly Projects are intended as a bit of fun designed to inspire a few edits to OpenStreetMap in peoples spare time. Hopefully they also help with the sense of community and attract a few new people to OpenStreetMap. Our fifth project is all about schools.
One of the methods we use to track progress is a daily count of the total number of schools mapped in OpenStreetMap. This is based on the data reported by TagInfo and the data is collected daily thanks to a script written by Adam Hoyle.

Normally we would expect to see the graph trend upwards, but with the schools project we started with an initial dip, having only just returned to square one. Why?
Well all is not bad. The chart above hides a lot of progress that has been made. Thanks to early work by Frederik and a uMap produced by Jerry, there has been a big focus on improving the mapping of existing schools. In many cases this meant converting a simple node (point marking the centre of the school) to a way (polygon) demarking the boundary of the school. The chart unfortunately misses these! There were also many cases where a school had been marked with both a node and a way. This is considered bad practice and the drop in the chart reflects how people have been cleaning this up.
We see that a hugely impressive 137 people have been helping to map schools in OpenStreetMap, editing a total of 3,300 schools!
So what progress has been made? To answer this we can refer to a number of new progress trackers. Firstly Harry Wood‘s school edit tracker. This counts the number of UK school edits that have been made. We see that a hugely impressive 137 people have been helping to map schools in OpenStreetMap, editing a total of 3,300 schools! For fun Harry’s tool also provides a leader board – congratulations to Robert W, Paul (southglos) and Mark S for taking 1st, 2nd and 3rd respectively.
We can also track progress by postcode region thanks to Robert W’s comparison tool. In my previous post we looked at how the KY postcode area was leading the way. Overall we have now increased the number of schools mapped in OpenStreetMap from 62% to 68% (excludes Northern Ireland data as this was added later). If we continue at this rate we will reach a massive 90% by the end of the quarter. I think we can get closer to 100% as the pace will pick up now that the initial clean up of existing data is coming to an end. 🙂
Up for the challenge? To join us in adding schools to OpenStreetMap see here. Never mapped before? No worries, contact us for a helping hand.
Harry Wood
‘The chart unfortunately misses these’ Doesn’t the chart just show the total count of nodes and ways? So if someone converts a school from node to way, it should show no change. I guess the decrease must be just due to removing duplicates …which is an important data improvement!
RobJN
Exactly right Harry. I had something similar written but the text was getting too long so it got chopped!
Mapped: Every school in the Outer Hebrides and Shetland Islands! | Mappa Mercia
[…] Nodes converted to ways Following lot’s of data clean up we are nearing 80% of schools mapped as land areas rather than simple points. We should hit this in […]
weekly 288 | weekly – semanario – hebdo – săptămânal – haftalık – 週刊 – týdeník – edisi
[…] Escuelas: Volviendo al punto de partida? Una entrada del blog Mapa Mercia. […]