Conflation & Validation: OSM Conflator

posted in: Participate | 3

When Ilya approached the UK OpenStreetMap community about incorporating third party data (Shell petrol stations) into OSM he had already ran the data through his “OSM Conflator” tool. As part of the project he also created a “Community Validation” tool. I decided to take a look at both of these using Asda petrol station data as a test case.

In a series of posts I will share my experience with conflation and validation. This first post covers just OSM Conflator, with a follow on posts in the coming days covering the Community Validation tool and some reflections on the process.

Intro to OSM Conflator

OSM Conflator is a command-line tool written in Python 3 that compares a third party dataset against OpenStreetMap. It does not directly edit OpenStreetMap but instead gives you two outputs based on what it finds. The first, preview.json, can be loaded into an online tool such as geojson.io to visualise the differences. The second, a OSM change file, can be opened in JOSM for uploading in to OpenStreetMap. In both cases it assumes the third party data is correct and more up to date than any OSM data it is replacing. As such it is worth using the Community Validation tool to check the results before uploading.

For now the third party data must be point (node) data but it can match to both nodes and ways in OpenStreetMap; downloading the most recent data each time you run the script. The matching is initially done by distance and you can set the maximum tolerance (e.g. 100 meters). If the third party data has a unique reference key (e.g. a store ID number) then this can be added to OpenStreetMap the first time you merge the data. The next time you run the comparison, for example if a retail chain has changed their opening hours, then OSM Conflator relies on this reference key rather than having to undertake a proximity search.

Inputs

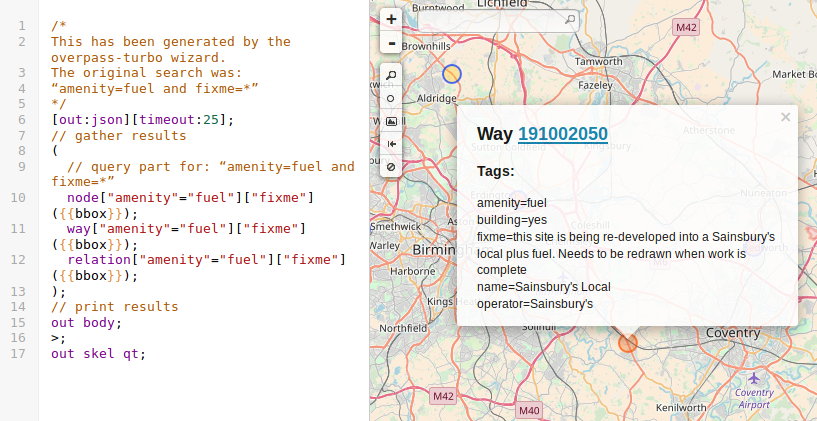
OSM Conflator requires two inputs: a profile and the third party data. The profile sets the search criteria and which third party tags should always replace values on matched OSM objects. In the case of the Asda petrol stations the search criteria was for ‘amenity=fuel’ objects within 100 meters. The tags to upload were ‘brand’, ‘opening_hours’, ‘website’, ‘phone’, ‘addr:street’, and ‘addr:postcode’. The data included a unique reference ID so I set the profile to write this to OSM.


My OSM Conflator profile file.


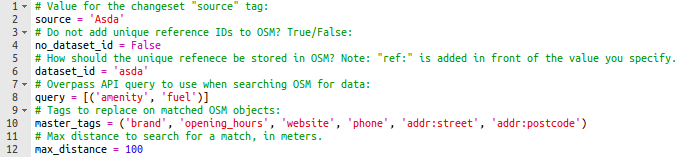
The profile is actually created as a Python file but is simple enough that you don’t need any Python experience. If you are however a pro at Python you can add to the profile. Example additions include tag transformations (e.g. reformatting telephone numbers in to ‘+44 <Area Code> <Number>’ format) or even code to download the source data direct from the third party’s website. If like me you are not a Python pro then you will need to provide OSM Conflator with a separate file including the third party data. This must be in a JSON file format.


Extract of the Asda source data (rows and additional tag columns omitted).


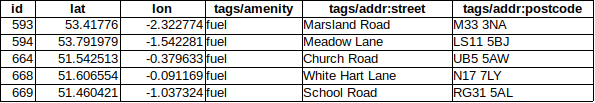
Getting the third party data into a JSON file is easy when you know how. Prepare a table like the one above with columns for latitude (lat), longitude (lon) and, if you have it, the unique reference key (id). For the tags you wish to add to OpenStreetMap name the columns according to the standard tag usage within OSM adding ‘tags/’ in front of the column name. To convert your table into a JSON file simply copy and paste the data in to www.convertcsv.com/csv-to-json.htm making sure to select “First row is column names” and “Recreate nested objects and arrays” in the options. Copy the output into a blank notepad and save as ‘data.json’.

Running the tool

With the profile and third party data now prepared the final step is to run OSM Conflate. As noted this is a Python 3 command-line tool. I assume you have already installed this and have also installed ‘pip’ which is a package management system used to install and manage software packages written in Python. With both of these installed go ahead and open a command/terminal window and run “pip install osm_conflate” to install OSM Conflate. Finally to run OSM Conflate using your profile and data file run “conflate -i data.json -v -o result.osm -c preview.json profile.py”. When it has finished running try opening preview.json in geojson.io to get a visualisation of the results.

In the next post we will look at how to load the outputs in to the Community Validation tool.

The streets they are changing

posted in: Uncategorized | 3

The streets they are a changing


The view along our streets is about to change thanks to the mobile phone and OSM mappers are presented with a vast new challenge.

BT are scrapping half of the 40,000 phoneboxes on our streets over the next five years, citing  a drastic drop in useage.  One third of phoneboxes never have anyone make a call from them, and BT measure call volume from all kiosks at a mere 33,000 a day. Phonebox numbers reached their peak in 1992, when there were 92,000 of them.

Reducing the estate  will save BT £6m a year in maintenance, mostly repairing vandalism and removing graffiti. More than half of phoneboxes lose money and the number of calls is declining by more than 20% per year. However, phoneboxes are still used by people who can’t afford mobile phones, and in emergencies when mobile phone batteries are dead or there is poor mobile phone coverage ( in many rural and mountainous areas)

7,000 of the  phoneboxes are the  world-famous red phone boxes designed in the 1930s by architect Sir Giles Gilbert Scott, who also designed  Liverpool Anglican Cathedral, Battersea Power Station, and Bankside Power Station (now the Tate Modern).

Many of the red phoneboxes which have already been decommissioned have been re-purposed  as mini-libraries and art galleries or to house defibrillation machines, information centres, shops or exhibitions.  About 2,400 are preserved by Historic England as Grade II listed buildings.

The rules of the government regulator Ofcom govern  how BT may remove phoneboxes, and addionally there may be planning regulations from local authorities to satisfy. If there are two kiosks within 400m walking distance of a site, BT is allowed to remove one, as long as there is one left. But if BT seeks to remove the only phone booth on a site, it must inform the public and consult with the local authority which has 90 days to object, which is known as a local veto.

According to taginfo data there are 18,000 phoneboxes (amenity=telephone) in the UK, so we’ve managed to map about 50% of them, taking 14 years to do so. So our data is set to degrade over 5 years as the estate shrinks and we need to keep up to date with which ones are being removed (and also of course to map those that are missing!)

To add to the scale of the challenge  1,000 phoneboxes will be replaced in major UK cities by  new structures called Inlinks from InLinkUK. Each InLink provides ultrafast, free public Wi-Fi, phone calls, device charging and a tablet for access to city services, maps and directions.

The services are free because they’re financed by large digital screen advertising on the structures.

As well as the challenge of locating and mapping these structures is the tagging challenge. Which or all of these?

amenity=telephone

wifi=free

internet_access=wlan

advertising=screen

amenity= device_charging_station

tourism=information

Inlinks have been rolled out already in London and Leeds, and are scheduled for Birmingham in 2018. If you want to find the locations they’ve been provided here by InLink. Because they’re provided using Google Maps the data is useless for OSM except for using as a guide to go out and map them. So I asked BT, via  Business Development, if they could provide me data that would be suitable for adding to OSM. Here’s the  astonishing answer:

” Have heard back from the InLink (and payphone) team and they have a policy position – which is they don’t share locations of either Payphones or InLinks with mapping organisations as it would then make it easy for vandals and criminals  to determine the location of our estate and conduct attacks against it.”

Quite frankly this is a ludicrous position worthy of the fifteenth century when maps were regarded as military secrets.

Firstly, it’s discriminatory. Do they know they’ve already published an online map of Inlinks? Do they know that for several decades Ordnance Survey have published paper maps showing the location of phoneboxes in mountainous areas for emergency purposes?  Do they know that many local authorities publish online map service using Ordnance Survey data that locates every phonebox with the acronym TCB (for Telephone Coin Box)? Quite where this stands under competition laws is an interesting point, but way beyond our pockets to explore.

Secondly, it’s hardly a great method for letting potential customers know where to access the services.

Thirdly, what’s the profile of your average vandal? Someone who  is a node on the globalised corporate network and uses online resources and data  tools to ensure they optimise available resources for their campaign of  vandalism?  Why waste time wandering about looking for targets and forfeiting valuable vandalising time? Why waste valuable time going out to vandalise something that’s already been done by a rival crew? Or is it some antisocial human node with who-knows-what chemicals coursing through their brain, opportunistically trashing their local community because they’ve got neither the desire or means to travel.

I suggest BT planners look beyond the sphere of their corporate bubble with its group-think managementspeak and bring some appreciation of the real world (aka commonsense) to bear.

BT are now promoted to mappa-mercia’s Hall of Shame, along with West Midlands Fire Service and Severn Trent Water for refusing to provide data on the spurious grounds of protecting publicly visible infrastructure  against attack.


Petrol stations with a fixme tag

posted in: Map Improvements, Participate | 1

As we described when we kicked off this quarters UK project to map petrol stations, recent community validation of third party (import) data has highlighted much outdated and erroneous data within OpenStreetMap :-(. For the Shell import we captured some of this and added it to a “fixme” tag. If you have not yet come across this tag then it is one in which OpenStreetMap users can flag something that looks wrong or requires additional information to improve the map.

It is possible to view petrol stations with a fixme tag by using Overpass Turbo scripts. We have done this already so all you have to do is click this link and press run. Results are visual as shown in the example below. There are approximately 130 petrol stations with a fixme tag so with some effort we should be able to review them all. Happy mapping!

Example result from Overpass Turbo.

Tracking our progress mapping petrol stations

posted in: Uncategorized | 2

When we did the highly successful quarterly project to map schools we tracked the progress using a script that collated data on a daily basis from TagInfo UK. This enables us to see how we are getting on, both in terms of total features mapped, but also the split between nodes, ways and relations. We can then produce charts like the one for schools shown below.

UK Schools mapped in OpenStreetMap


This script was also used on the following quarterly projects up to the end of Q1 2017. Unfortunately I failed to set it up for the following quarterly projects, and worse still, failed to notice that the script stopped running in May 2017. It looks like the reason behind this was a change in the server that we are hosted on causing a 32bit vs 64bit error – but I’m no expert!

The important thing is that I have it up and running again and have added tracking for petrol stations. You can view the data by following this link.

Q1 2018 mapping project: Petrol stations

posted in: Participate | 1

Following a lengthy discussion on the talk-gb mailing list and several false starts, Ilya recently imported UK Shell petrol station data into OpenStreetMap.To confirm the quality of the third party data a brand new community validation tool was developed. Use of this tool highlighted a lot of inconsistency in the way we map – as such let’s make petrol stations the quarterly mapping project for Q1 2018.

According to Statistica there are some 8450 petrol stations in the UK. Compare this to OpenStreetMap, where TagInfo shows that we have mapped 7200. Not bad – just 1250 more to go! Let’s see if we can get to the magic 8450 by the end of the quarterly project (or show that the real number is indeed different). This also gives us a great opportunity to review the existing data, updating old tags to reflect on-the-ground change and converting petrol stations mapped as points (nodes) to ones mapped as areas (closed ways).

Image: CC-By-Sa 2.0 Betty Longbottom