Patterns in address data

posted in: Uncategorized | 1

Prompted by recent discussions about house numbers becoming illuminated features in order to aid delivery of fast food by Deliveroo riders after dark I used an idle lockdown moment to peruse the incidence of house numbers in the UK by using taginfo.  We have a sample size of 2 293 590 house numbers with 29 881 values.

Initially I thought I had stumbled upon a curious feature as the frequency of house numbers follows a sequential pattern i.e. 1 is the most frequent house number followed by 2 and so on.  I was about to muse on why this should be and concoct all kinds of theories about mapper behaviour and urban planning,  when a statistician informed me this is a merely an example of Zipf’sLaw in operation.

Now I’m not a statistician and after two lines of the Wikipedia article linked above I’m lost so I don’t know what sample size you need for a perfect sequential distribution or whether Zipf’s Law merely describes the phenomenon or explains it.

Our house number data follows Zipf’s Law until no 38 (except for the number 13 for which there are cultural reasons associated with superstitious beliefs about bad luck which depresses its occurrence). Then  a curious pattern emerges with 40 and 39 reversing sequence repeated at  50 and 49;80 and 79; and 90 and 89.

After 100 there are only interspersed regular sequences and fairly rapidly any discernible pattern disappears.

I guess this a typical pattern of distribution which can be explained by the kind of complex tools that statisticians use and as the sample size increases the further the sequential order is exhibited . So I further guess there are no mysteries lurking in the data we have gathered, but it would be nice to have this confirmed(or even explained) by skilled practitioners, if possible in layman’s terms.

OSMUK first quarterly project 2020: Parks

posted in: Uncategorized | 2

Last week saw me surveying Ward End Park in Birmingham. This park had had no attention from OSM mappers since it was first surveyed in 2009 and so looked a good candidate for the quarterly project. Aerial Imagery also showed significant detail to be missing (mostly footpaths).

The park is an innner city park close to some economically-stressed neighbourhoods, but shows none of the vandalism you might have expected. It is also unexpectedly litter-free: this either shows it’s a well-respected local amenity or low useage in February means no litter. It is largely just open parkland and grass with only one small flower bed in front of  Ward End Park House: this certainly cuts down on maintenance costs for the Council. The Friends of Ward End Park have a community and schools garden(newly mapped post-survey) adajcent to the house

Birmingham Corporation purchased 43 acres of land in September 1903 and a further 11 acres in November 1903. These were officially opened to the public as Ward End Park on 14 May 1904. Most of the benches are marked 1904-2004 to commemorate the centenary of its opening.

Also newly-mapped is a commemorative plaque on the house the for the construction of the boating pond commissioned in the bad winter of 1908-9 in order to provide work relief  for the unemployed, who excavated 50,000 cubic yards of earth. The house with its graceful architecture is Grade II listed – when first surveyed it was a thriving community centre, now it is sadly boarded up and unoccupied.  There are map records of a house here from 1759, but the current structure probably dates to the late 18th century with additions made in the Victorian period.

Two crown green bowling pitches have also fallen into disuse since the park’s first appearance in OSM: this is probably not just council austerity, many pitches in pub grounds have also disappeared. Does the decline in number of pitches reflect changing social tastes in leisure patterns, or economic pressures of land development and council austerity? Perhaps there’s some academic or journalistic research out there invesigating this.

Ward End Park has a Sons of Rest Pavilion, again now sadly boarded up and disused. The Sons of Rest movement started in 1927, when a group of ‘Industrial Veterans’ met at Handsworth Park in the north of the city. The first purpose-built building was built in 1930 and the movement expanded to over 3000 members in 29 parks. The purpose of the buildings was to provide social facilities such as snooker and dominoes for “retired gentlemen”. I think this was a movement confined to BIrmingham and the Black Country, but a web search reveals little information except for local press reports about them being burnt by arsonists. I shall do some further research to satisfy my curiousity. Making sure all the surviving Sons of Rest facilities are mapped might be an interesting local project.

Sons of Rest is on the left, monstrosity on the right courtesy of Birmingham City Council

I also found, and mapped,  two recent artworks. One is a mosaic and the other is a log sculpture of an acorn, made from a single 2.5 ton piece of English Oak from Worcestershire in 2014.

More evidence of social and economic change is the disappearance of the park’s public toilets since the first OSM survey. At least these haven’t just been boarded up and left to decay: the building has been repurposed as a retail unit and is currently occupied by a money transfer business.

The Park is unusual in being formed ot two parcels of land separated by a railway line and joined by a single bridge whose side barriers have been colourfully adorned by local street artists (not vandalistically sprayed with “tags”). I’ve found the bridge on maps dating back to before the park was constructed and it looks like it was for a farm track linking fields. The southern part of the park was not part of the original 1904 park.

So a short 90 minute stroll on a crisp showery early spring day, not only improved OSM’s coverage of this park but revealed some intriguing history and social/economic change. It’s a highly recommended acitivity. Has anyone else been out doing this quarterly project and have something interesting to relate?


The images are mine except for the one of the Park House which is from Wikimedia Commons


A unique OpenStreetMap project

posted in: Uncategorized | 3


Every Quarter (3 months) the OpenStreetMap UK embarks on a community project to improve the map and,  whilst working together, to build our community. The final quarter of 2019 saw us trying to fix some of the FIXME and  fixme tags in our data. Pretty obvious  OK?  Something needs fixing so let’s go fix it.

For the first time in the history of our Quarterly Projects on first sight it looked like we actually managed to make the map worse. The number of fixmes after 3 months of effort was higher. So what went on?

First the data: FIXME is an older tag generally no longer in use, having been replaced by fixme. FIXMEs did decrease in number from 10186 to 9718; a total of  468 less(4.6%).But fixmes increased by 1,007 from 62,287 to 63,294 ( 1% increase)

Both variations have a huge variety of values: 2,724 for FIXME and 17,104 for fixme. There are large number associated with highways , mostly footpaths, that need to be continued to completion; with missing.incomplete addresses; and  noting approximations that require either better aerial imagery or a resurvey. But mostly they’re free text ranging from the verbose to the terse; often quirky and sometimes humorous. There are a few fiery ones that indicate an anger management requirement.

Some of the more noteworthy examples:

“used this takeaway but can’t remember what it’s called” – obviously the fare was such it evacuated not only the bowels but the memory bank as well!

“despite name not much of a park”- you can feel the sense of disappointment from here

“bunkum” – wins first prize for terseness

“steps WERE here but now probably impassable”

“this  section of riverbank is unstable making the path dangerous” – glad you survived!

“can’t remember which bits road and which footpath”

“this really is the edge of a defensive ditch but it is a brick wall more curvy than this”

“if this street has a name we want to know about it” – probably been reading too many cheap detective thrillers.

“I hope to come back sometime and improve the tagging. Feel free to do so in the meantime”

Anyone feel like a challenge? Try this one: “Houseowner was insistent there was no right of way along this route  past their house. OS map suggests otherwise. Possible case of obstruction given the owners attitude and NOT PATH sign.”

There are so many stories behind FIXMEs and fixmes . There are tales of frustration whilst out surveying: lost notes, faulty memory, unfocussed photos, not enough time to explore further. And all the good intentions to return and actually apply the fix but being thwarted by lack of time or inclination.

And  there they languish, plaintively beckoning to data travellers to pay them some attention. And there they will accumulate;  testimony to human frailty, flavouring the data with tales of mapping adventures  long forgotten, often by the authors themselves. The quarterly project has demonstrated it’s just too difficult to make much of a dent in  cleaning them up.

So finally, rather than see them as something to be eradicated ( although there are many that deserve such a fate), I’ve come to the conclusion that it is precisely this kind of social geology laid down by human curation that sets OpenStreetMap data apart . Long may it continue!

Drone Imagery from the Seventeenth Century

posted in: Uncategorized | 0

If ever you are visiting the city of Lille in northern France take some time out to visit the basement of the Palais des Beaux-Arts, home to fourteen relief maps of  fortified French cities. These intricately detailed maps (really they are scale models and almost works of art in their own right) are a regional collection that was donated to the city of Lille in the 1980s from a larger collection housed in the Hôtel des Invalides military museum in Paris.

Think of them as the seventeenth century equivalent of aerial imagery collected by drones.

The collection was originally commissioned by King Louis XIV  in the 17th century as a military information system but quickly became a demonstration of royal grandeur.  Their building continued until the time of the Emperor Napoleon III and continued the tradition of previous centuries particularly  of the 15th and 16th when they were used by Italian military engineers as an aid to  fortification design.


The relief maps are of considerable size – the map of Lille itself is 18 sq m and stretches across ten tables.  And this is all that remains of the original 60 sq m! Generally the maps are of an extent that the viewer is placed at the range of cannon fire into the centre of a city. Naturally as cannon range improved so the maps got larger in extent.

The models were built on to  maps drawn from field surveys which were stuck on to the tables with suitable annotation to let the model builders know what went where. The buildings were made from wooden blocks covered in sheets of decorated paper to depict finishes such as stone, brick, wood, tile and thatch. Much more architectural detail was added to the more important buildings. Gardens and fields were represented with coloured silk and trees from wire wrapped in silk thread. The detail is exquisite.

The relief maps have survived the centuries well thanks to loving restorative care and are sensitively displayed and curated. They remain an important part of the history and development of mapping

If you want to see the real thing you can visit the impressive fortifications of the nearby Lille Citadelle built by the renowned French military engineer Vauban

Mapping a New Town being developed on a vanished national landmark

posted in: Uncategorized | 1

It’s not often you get the opportunity to map a completely new town from the ground up, so mappa-mercia volunteers (all four of us)  descended on Houlton, next door to Rugby Warwickshire to do just that on a wet Saturday 1st December. Houlton is the name for a new town of 6,200  homes that is growing on the site of the decommissioned Rugby Radio Station, whose large antenna masts were long a major landmark on the journey north and south along the M1 motorway. Houlton had been marked as a construction site for some time in OpenStreetMap, but a trawl of local news sites suggested it was fast being developed with residents  already moving in – so time for some mapping action!

Its name mirrors the name of Houlton Maine USA , originally the other end of the transatlantic radio telephony and telegraphy circuit which received the very first transatlantic voice broadcast from Rugby Radio Station in 1927.

First opened by the General Post Office  in 1926, at its height in the 1950s it was the largest radio transmitting station in the world, with a total of 57 radio transmitters, a network of  820ft masts, 27 miles of copper cable in the suspended antennae covering an area of 1600 acres.

It used so many water cooled valves  that two reservoirs each with a capacity of about quarter of a million gallons of water were necessary  to feed a  heat exchange system.

Rugby set vast numbers of radio-controlled clocks in Britain  with the National Physical Laboratory’s time signal -but its strategic significance was the use of VLF transmissions to communicate with Britain’s submarine fleet

Technology marches on however and its functions were transferred elsewhere in the early years of the 21st Century and the station’s physical infrastructure dismantled. All that remains is ‘C’ building which is a protected heritage building and will form the nucleus of a new commercial town centre.

So big is the development that it will take almost 20 years to complete and is involving multiple development and finance partners. We spotted at least three development groups constructing houses on the site. There’s already a new primary school on site, together with  a community centre, visitor centre and an excellent restaurant – the Tuning Fork – named after an essential frequency tool.

In fact to walk round the completed section of the town  recording street names is to walk through a historical gallery of names famous in the development of radio: Marconi Close (naturally), Maxwell Road (naturally),  Walmsley  Road(senior Post Office engineer), Hughes Drive (inventor of the microphone and the printing telegraph),  Angwin Avenue (senior Post Office Engineer and first Chairman of Cable &Wireless),  Faulkner Road (senior Post Office engineer), Shaughnessey Way (senior Post Office engineer)

We decided to survey in a team rather than individually – it was less efficient but more sociable. We discussed and agreed as we went round that it was better to tag Houlton as a separate town rather than a suburb of Rugby (no objective criteria- it just felt right) and it enabled Rob to explain the  structure of the electricity distribution network. It also enabled us to establish the restaurant as excellent as we had to retreat there mid-morning to escape the cold drizzle and sample their coffee and cake!

The site is well-provisioned with cycle paths and what will become a network of footpaths along linear parks. What we didn’t see were any bus stops so it’s either going to be a car-centric development or there are just not enough occupied homes yet to make it worthwhile to run any bus services.  It was tempting to walk past the open barriers on what was a slack working day to explore more of the road network that is under construction, but we thought it would be prudent to observe the safety warnings- maybe at a later date  we can gain permission to survey beyond completed sections.

There’s another large infrastructure project underway, adjacent to Houlton, across the A5 trunk road with a massive expansion of the Daventry International Rail Freight Terminal.

Judging by the number of nearly finished homes, the site will be changing rapidly so we’ll be revisiting at regular intervals to map the progress of the new town. in the meantime anyone who’s passing and can map will save us work and further demonstrate the power of crowd-sourced mapping  to keep a map up-to-date.

UK Defibrillator Map

posted in: Uncategorized | 0

Over the last few days there has been significant national press attention to a project to create a map of the locations  of public defibrillators. The project is a collaboration between the British Heart Foundation , Microsoft and the NHS.  One of the pilot areas will be the West Midlands Ambulance Service.

OpenStreetMap already has a large database of the locations of these devices, and in fact devoted one of our UK Quarterly Projects to the theme. Of course there is a map to visualise the data. There is also a useful set of tools and information to help mappers

Taginfo returns a total of 1765 defibrillators mapped in the UK in OpenStreetMap

We sincerely hope the the project speeds its delivery by building on our data and using OpenStreetMap’s crowdsourcing network of volunteer mappers.

Joy Diversion: Mapping in Manchester

posted in: Uncategorized | 0

Saturday 19th May saw the UK OpenStreetMap community and Open Data Manchester join forces for an afternoon of exploring central Manchester. Several mappers from the Midlands made the trip and boy, did we have fun!

Our hosts had prepared some great “Explorer Backpacks” and we soon broke off in to teams for our expeditions into the unknown. From the waterways to historic relics, the missions were wide ranging – we even had a Geiger counter on hand to find the spot with the highest background radiation!

After soaking up the sun we headed back to Federation House to share our findings before heading for a well earned drink.

Dan S: It was ace, in particular the slightly whimsical mapping trip we did, following psychogeographic suggestions prepared by the Joy Diversion organisers. That was a good way to get new mappers and experienced mappers working together on an equal footing.

Samantha: I really enjoyed the event on Saturday. I’d love to get out and about around Manchester and learn more about the city in general. If anyone else is local and wants to go exploring, to add to the map or otherwise please let me know.

Tony Shield: Really enjoyed the ability to meet like minded people and get a deeper understanding of the OSM project. Going out and surveying then placing the information on the map was great. Seeing some of the uses the data could be used for was really interesting.

Martyn: Joy Diversion was a great afternoon, I’ve just updated OSM with the Team Crocodile survey (cycle and car parking, playgrounds, water taxi, footpaths and more). Keep on improving the map.

A big success then! Partnering with Open Data Manchester worked really well. Nice folk and a good opportunity to spread the word about OSM without having to arrange a venue and drum up attendees from scratch.

Post content: OpenStreetMap United Kingdom CIC (with minor amends). Local mappers Brian and Rob are Directors of the community interest company, which focuses on supporting OSM in the UK.

The streets they are changing

posted in: Uncategorized | 3

The streets they are a changing


The view along our streets is about to change thanks to the mobile phone and OSM mappers are presented with a vast new challenge.

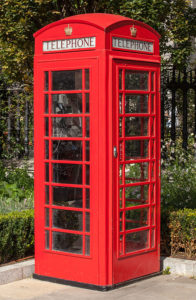
BT are scrapping half of the 40,000 phoneboxes on our streets over the next five years, citing  a drastic drop in useage.  One third of phoneboxes never have anyone make a call from them, and BT measure call volume from all kiosks at a mere 33,000 a day. Phonebox numbers reached their peak in 1992, when there were 92,000 of them.

Reducing the estate  will save BT £6m a year in maintenance, mostly repairing vandalism and removing graffiti. More than half of phoneboxes lose money and the number of calls is declining by more than 20% per year. However, phoneboxes are still used by people who can’t afford mobile phones, and in emergencies when mobile phone batteries are dead or there is poor mobile phone coverage ( in many rural and mountainous areas)

7,000 of the  phoneboxes are the  world-famous red phone boxes designed in the 1930s by architect Sir Giles Gilbert Scott, who also designed  Liverpool Anglican Cathedral, Battersea Power Station, and Bankside Power Station (now the Tate Modern).

Many of the red phoneboxes which have already been decommissioned have been re-purposed  as mini-libraries and art galleries or to house defibrillation machines, information centres, shops or exhibitions.  About 2,400 are preserved by Historic England as Grade II listed buildings.

The rules of the government regulator Ofcom govern  how BT may remove phoneboxes, and addionally there may be planning regulations from local authorities to satisfy. If there are two kiosks within 400m walking distance of a site, BT is allowed to remove one, as long as there is one left. But if BT seeks to remove the only phone booth on a site, it must inform the public and consult with the local authority which has 90 days to object, which is known as a local veto.

According to taginfo data there are 18,000 phoneboxes (amenity=telephone) in the UK, so we’ve managed to map about 50% of them, taking 14 years to do so. So our data is set to degrade over 5 years as the estate shrinks and we need to keep up to date with which ones are being removed (and also of course to map those that are missing!)

To add to the scale of the challenge  1,000 phoneboxes will be replaced in major UK cities by  new structures called Inlinks from InLinkUK. Each InLink provides ultrafast, free public Wi-Fi, phone calls, device charging and a tablet for access to city services, maps and directions.

The services are free because they’re financed by large digital screen advertising on the structures.

As well as the challenge of locating and mapping these structures is the tagging challenge. Which or all of these?

amenity=telephone

wifi=free

internet_access=wlan

advertising=screen

amenity= device_charging_station

tourism=information

Inlinks have been rolled out already in London and Leeds, and are scheduled for Birmingham in 2018. If you want to find the locations they’ve been provided here by InLink. Because they’re provided using Google Maps the data is useless for OSM except for using as a guide to go out and map them. So I asked BT, via  Business Development, if they could provide me data that would be suitable for adding to OSM. Here’s the  astonishing answer:

” Have heard back from the InLink (and payphone) team and they have a policy position – which is they don’t share locations of either Payphones or InLinks with mapping organisations as it would then make it easy for vandals and criminals  to determine the location of our estate and conduct attacks against it.”

Quite frankly this is a ludicrous position worthy of the fifteenth century when maps were regarded as military secrets.

Firstly, it’s discriminatory. Do they know they’ve already published an online map of Inlinks? Do they know that for several decades Ordnance Survey have published paper maps showing the location of phoneboxes in mountainous areas for emergency purposes?  Do they know that many local authorities publish online map service using Ordnance Survey data that locates every phonebox with the acronym TCB (for Telephone Coin Box)? Quite where this stands under competition laws is an interesting point, but way beyond our pockets to explore.

Secondly, it’s hardly a great method for letting potential customers know where to access the services.

Thirdly, what’s the profile of your average vandal? Someone who  is a node on the globalised corporate network and uses online resources and data  tools to ensure they optimise available resources for their campaign of  vandalism?  Why waste time wandering about looking for targets and forfeiting valuable vandalising time? Why waste valuable time going out to vandalise something that’s already been done by a rival crew? Or is it some antisocial human node with who-knows-what chemicals coursing through their brain, opportunistically trashing their local community because they’ve got neither the desire or means to travel.

I suggest BT planners look beyond the sphere of their corporate bubble with its group-think managementspeak and bring some appreciation of the real world (aka commonsense) to bear.

BT are now promoted to mappa-mercia’s Hall of Shame, along with West Midlands Fire Service and Severn Trent Water for refusing to provide data on the spurious grounds of protecting publicly visible infrastructure  against attack.


Tracking our progress mapping petrol stations

posted in: Uncategorized | 2

When we did the highly successful quarterly project to map schools we tracked the progress using a script that collated data on a daily basis from TagInfo UK. This enables us to see how we are getting on, both in terms of total features mapped, but also the split between nodes, ways and relations. We can then produce charts like the one for schools shown below.

UK Schools mapped in OpenStreetMap


This script was also used on the following quarterly projects up to the end of Q1 2017. Unfortunately I failed to set it up for the following quarterly projects, and worse still, failed to notice that the script stopped running in May 2017. It looks like the reason behind this was a change in the server that we are hosted on causing a 32bit vs 64bit error – but I’m no expert!

The important thing is that I have it up and running again and have added tracking for petrol stations. You can view the data by following this link.

Birmingham is the Bus Stop Capital of Europe

posted in: Uncategorized | 0

The city has more bus stops per kilometre than any other city in Western Europe according to an article published in the Birmingham Post.

The revelation comes from a press release issued by Transport for West Midlands which is responding to passenger criticism of  its recent decision to suspend 60 bus stops on major bus routes in a bid to speed up bus journey times.

There are more than THIRTEEN bus stops per kilometre in Birmingham, which  compares to  to three-and-a-half in Barcelona, two-and-a-half in Paris and less than one per kilometre in Berlin.

The three leaders according to the data presented are Birmingham (13.5), London (12.6), Manchester (9.9). Budapest is the closest European city, with just over eight.

It does have to be said that Birmingham and the West Midlands suffer  in comparison to other European cities from not having complementary rapid transit systems such as metro lines and tram lines (there is only one surface metro line in the West Midlands). Our main means of “rapid” transit remains buses which is probably why there’s such a large density of bus stops. Culling the number is an attempt to return the description “rapid” to our transit system which has to compete with the congestion from cars.