Following on from the tweet summary from Andy’s (@pigsonthewing) Wikidata presentation at State of the Map 2015, you can now watch the full talk:
Mappa Mercia at State of the Map US 2015
Last weekend saw hundreds of OpenStreetMappers descend on New York City for State of the Map US 2015. Our very own Andy Mabbett (he’s @pigsonthewing on twitter) was in attendance and gave two talks; the first on Wikidata and it’s inclusion in OpenStreetMap, whilst the second (a 5 minute ‘lightning talk’) was on us, the Mappa Mercia community. Here’s how it played out.
Wikidata for mappers
We are very excited for @pigsonthewing's talk on Wikidata at @sotmus! #SOTMUS
— FixWikiMaps Project (@fixwikimaps) June 6, 2015
. @pigsonthewing speaking about @wikidata at State of the Map US #sotmus pic.twitter.com/tNbRrEzTdp
— Katie Filbert (@filbertkm) June 6, 2015
Matching #wikidata to #OpenStreetMap: "95% certain that these are match and we have proposed" @pigsonthewing speaking at #sotmus
— Mappa Mercia (@mappamercia) June 6, 2015
.@pigsonthewing making a plea for allowing bots to tag OSM with wikidata info. I think he's right. #sotmus
— Tom Lee (@tjl) June 6, 2015
#SOTMUS Over 176K matches for @Wikidata & @OpenStreetMap entities: http://t.co/QBCQjZZ65Z We should let a bot tag these in OSM
— Andy Mabbett (@pigsonthewing) June 6, 2015
.@pigsonthewing's summary: "Wikidata [..] is copyright-free, please use it. You can tag objects in OpenStreetMap with Wikidata IDs" #sotmus
— Mappa Mercia (@mappamercia) June 6, 2015
I raised a ticket about @Wikidata in @OpenStreetMap's "ID" editor. #SOTMUS / @bhousel http://t.co/j6U6cqiATv
— Andy Mabbett (@pigsonthewing) June 7, 2015
You can read more about Andy’s proposal to automate wikidata tagging in OpenStreetMap here. To see which map features already include a wikidata tag check out this map.
Mappa Mercia
Andy’s ‘lightning talk’ on day 2 showed off some of our work and discussed how to build a local community:
Hey cool heritage mapping in England by @pigsonthewing check it out Gopi @theblueyonder #sotmus pic.twitter.com/aIApXXtv0t
— Erica Hagen (@ricaji) June 7, 2015
Enjoyed the prez on how to build a strong local #OSM community. Bottom line: You have to be open & inclusive @pigsonthewing #sotmus
— Datapolitan (@Datapolitan) June 7, 2015
Voice of Megan Smith
On Saturday a surprise speaker was announced – Megan Smith, Chief Technology Officer of the United States. Andy used the opportunity to capture a sample of her voice for ‘voice intro project‘ he instigated on wikipedia. You can listen to the audio clip on her wikipedia page.
Fix road names with iD editor
Have you been following our UK quarterly project to fix road names in OpenStreetMap and been wanting to contribute but don’t know how? If yes, then read on to find out how.
Firstly OpenStreetMap is a volunteer driven project that aims to build a free map of the world. The first 10 years of this project have been extremely successful – our contributors have collected data that is so rich and diverse that OpenStreeetMap now powers map data on hundreds of web sites, mobile apps, and hardware devices. Welcome to our community!
There are two ways to contribute to OpenStreetMap: you can notify the community of something that needs changing, or you can jump in and make the change yourself. Notifying the community is the easiest option but it may take some time for the change to be made. To add a note head over to openstreetmap.org and click “Add a note to the map” (the icon just above the question mark on the right hand side). You will need to drag the pointer to the correct location and type a comment in the text box.
Editing the map data requires a few more steps but the guide below will help you to fix a road name. We will be using the iD map editor but this task can also be accomplished with other map editing software such as Potlatch 2.
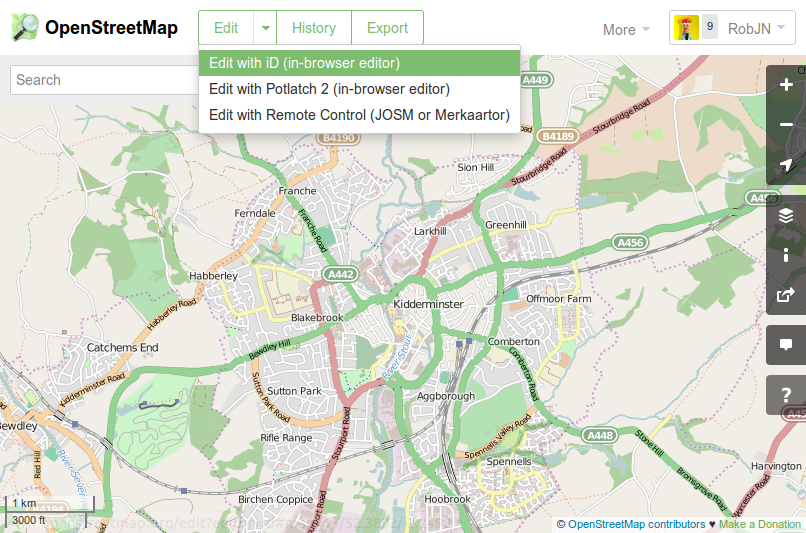
To check for incorrect road names in your local town move the map to the area of interest and click the “Edit” drop down arrow, then “Edit with iD”. This opens the iD map editor. If this is the first time you have used iD you will get a walkthrough guide that shows you how to edit OpenStreetMap. This guide can be restarted at any time by pressing “h” to bring up the help menu and then clicking “Start the Walkthrough”.
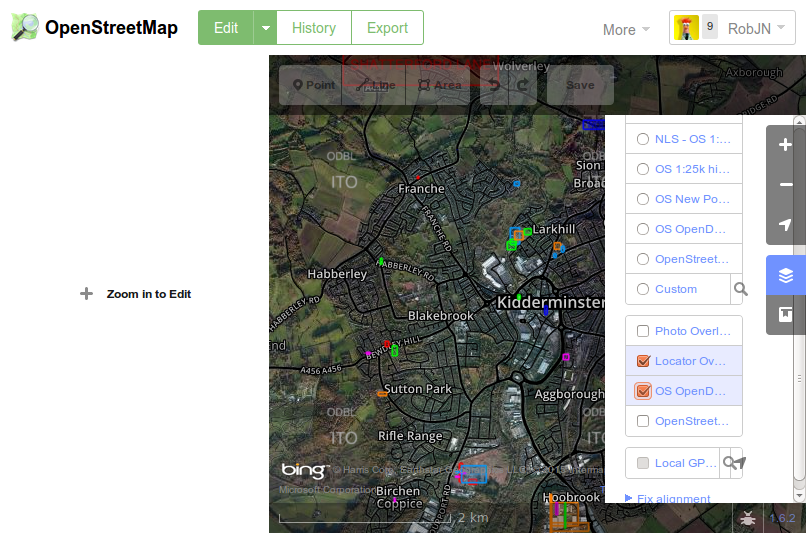
To see which road names need checking in your area click on the background settings icon on the right (or press “b”), then tick “OS OpenData Locator”. This brings up any brightly coloured squares on the map which indicate where the Ordnance Survey has a different road name than that of OpenStreetMap.
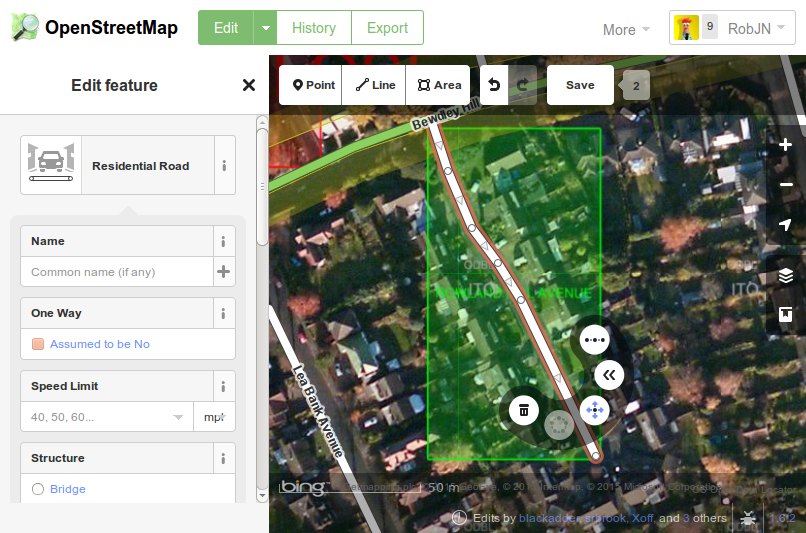
Once you confirmed the correct name (for example, by seeing what the road sign itself says) the you can enter this in OpenStreetMap by clicking on the road and then typing the name into the “Edit Feature” panel that opens on the left. Once finished don’t forget to click “Save”.
Congratulations, you are now part of a community of mappers that contribute and maintain data about roads, trails, cafés, railway stations, and much more, all over the world.
Change: How mature is OpenStreetMap?
There have been a couple of threads on OpenStreetMap’s mailing list this month to do with change. The first, entitled “Request for feedback: new building colours in openstreetmap-carto”, is all to do with a change to the way the default map style looks on openstreetmap.org. The second, “MEP – pipelines”, refers to a mechanical edit of the OpenStreetMap data. Both have been met with some level of resistance – but is this proportionate?
Change: For and Against
Failure to adapt and change can result in obsolescence and opens the door for new innovative competitors. The same is true for OpenStreetMap. We rely on an army of mappers to continue to contribute data and many of these mappers are motivated by the idea that the map data is being used and not just sitting idle. As our users’ needs change, so do our contributors’ – we are faced by a constant requirement to adapt. Fulfilling these requests for change in a timely manner is great for the long term success of OpenStreetMap.
Take tags for example: we don’t have a rigid set of tagging rules and as such contributors can come up with their own tags for new, never mapped before features. Over time preferred tags become more populous and gradually more contributors adapt to use the common tag – old tags may even get updated. If our contributors didn’t change then our data would be a miss-match of ‘stuff’ and would be difficult to add to and problematic for our end users.
But change is not always a good thing. Those same users who require us to adapt, are also likely to want us to provide a stable product. Our users have products and services that rely on our data and when we change something they may also need to update something on their side. As such unrequested change, or change with insufficient notice, may cause as much problems as a failure to adapt when desired.
“As OpenStreetMap matures the amount of prior notice of changes we will be expected to give will increase and we will be expected to announce planned changes to some of the smaller things”
Change in OpenStreetMap is often done in small evolutionary steps, however we’ve seen big changes too, such as the licence change and the introduction of new editing software. As OpenStreetMap matures the amount of prior notice of changes we will be expected to give will increase and we will be expected to announce planned changes to some of the smaller things, not just the big ones.
So lets look at the two changes currently being discussed on the mailing list.
Case 1: “Building colours in openstreetmap-carto”
This first change is to do with how the default map style on openstreetmap.org looks. It forms part of a larger piece of work to bring some standardisation to our default style. The changes come after a period of stagnation a few years ago during which it was often commented that our map style was a hotchpotch of colours, line styles and widths. The current changes bring standardisation and set the foundations for us to add new POIs (another often requested change). The general lightening of the style also makes it more suitable as a background layer to display overlaid data (again, often requested).
But who are the affected users? Well, OpenStreetMap is a data project – we create data and we distribute data – its right there on the wiki home page. The default map style, on the other hand, is provided as an additional extra: a bonus. We specifically limit the use of our default map through our ‘Tile Usage Policy’.
If you are an end user and are not happy with the change then you have an alternative. Simply grab our underlying data and render your own map using any style you wish. You could even use a previous openstreetmap.org default style!
Case 2: MEP – pipelines
This second change is a data change. It follows my example above where some work has been done to try to improve the tagging of a certain feature – in this case pipelines. The aim here is to create new use cases for our data. Although it hard to be certain, I would imagine that very few users are currently using our pipeline data. As such a notification of change, followed by a reasonable period of time for people to adapt is probably appropriate.
But was change even needed? Possibly yes – the aim is to improve both the quality and quantity of our data and to avoid potential conflicts with other tags. On the other hand, these conflicts are minor and most data users could work around them. So change may not be needed.
In this case I tend to look at the bigger picture. We have a group of contributors who are trying to help, and we probably don’t have many users of the pipeline data right now. If we block the change we won’t cause problems for our users (until they come to us and tell us that we’re not adapting to their needs!) but we risk putting a group of dedicated contributors off OpenStreetMap for good. In this case I believe the best solution is to support the change.
Your thoughts?
I’d love to hear your thoughts on this – where is OpenStreetMap in its maturity and what level of change is appropriate? Is there anything you would like to see changed? And is there anything that must stay the same?
Extracting centroids from OpenStreetMap
We previously showed how to create a simple map of pubs using Overpass to extract data from OpenStreetMap and uMap to display the data on a simple zoomable map. In this short update we show how to manipulate the data so that all pubs are shown as points of interest rather than a mixture of points and polygons.
This update article follows on directly from our previous article on creating an always up to date map using Overpass to extract data from OpenStreetMap and uMap to display the data on a simple zoomable map. We encourage you to read that earlier article before proceeding. In the comments I noted that I did not like how some of the data was shown as points, whilst the rest of the data was shown as polygons. Thanks to Martin Raifer (osmtogeojson) and Yohan Boniface (uMap) we can now fix that problem!
It turns out that Overpass was already able to return the centroids of polygons via use of the center output, however uMap did not yet understand the outputs. Being open source data I requested that the functionality be added to uMap. This meant first adding the functionality to osmtogeojson, the data library that uMap uses to understand OpenStreetMap data. This was achieved within a matter of days and following a quick update to uMap we’re all set to go. Let see how it works:
- We follow the same steps as per our earlier article. Read more here.
- At step 5 we use the following adjusted Overpass data call instead (note the “center” part that requests centroid data from OpenStreetMap):
http://overpass-api.de/api/interpreter?data=[out:json][timeout:25];node[“amenity”=”pub”]({south},{west},{north},{east});out qt;way[“amenity”=”pub”]({south},{west},{north},{east});out body center;>;out skel qt;
It’s as simple as that! Let see the result:
We think it looks great, and a lot more consistent than the mixed point and polygon map.
Update: Pop-up data
I have been asked to show how to add pop-up data to the map points. This obviously requires the data to already exist in OpenStreetMap. Assuming it does it simple to add this data:
- In uMap click the layers button (just under +/- ) and then click Edit (the pencil symbol).
- In the right hand pane scroll down to the Popup content template section of the Advanced Options.
- To add the pubs name and address to the pop-up simply edit this text box to include the following (based on the OpenStreetMap tags):
# {name}
{addr:street}
{addr:city}
Note that only a few pubs are tagged with their full address in Stratford-upon-Avon so you may have to click on a few on the map above before you get a pop-up with all this data shown.
Creating an always up to date map
In the previous post we showed that creating a map to show location data as a collection of pins (map markers) is easy using OpenStreetMap tools. But what if we wanted to keep that map up to date? In this article we’ll show how we keep our pubs map always up to date.
The landscape around is is always changing. Sometimes the changes are big and obvious, for example a new housing development, but changes can also be as subtle as a change in shop name. OpenStreetMap, which is commonly referred to as the wikipedia of maps, provides map data collected by a community of mappers. It emphasises local knowledge, with contributors keeping their local area up to date on the map. It is therefore the perfect source not only for the background base map, but also for the data we display on top of the base map.
Contributors use aerial imagery, GPS devices, and low-tech field maps to verify that OSM is accurate and up to date.
In the previous post we saw how uMap could be used to display map data in just the same way as Google Maps Engine/Fusion Tables. We have also previously seen how we can use Overpass to download data from OpenStreetMap. The uMap tool lets us link to Overpass to produce an always up to date map. Lets see how:
Map tutorial
Pubs are currently closing at a rate of 31 per week (source). Lets update our pubs map so that it’s automatically kept up to date by local OpenStreetMap contributors. As a secondary benefit the map will now work globally rather than just for Stratford-upon-Avon and surrounding land.
- Head to overpass-turbo.eu.
- Click Wizard and search for amenity=pub (learn about OpenStreetMap tags here)
- Click Export, Query, and then download/copy as umap remote data url.
- Paste the copied text in to a notepad and add “http://overpass-api.de/api/interpreter?data=” without quotes before it.
- The final result should look like:
http://overpass-api.de/api/interpreter?data=[out:json][timeout:25];(node[“amenity”=”pub”]({south},{west},{north},{east});way[“amenity”=”pub”]({south},{west},{north},{east});relation[“amenity”=”pub”]({south},{west},{north},{east}););out body;>;out skel qt;
- The final result should look like:
- Now navigate to umap.openstreetmap.fr or one of the alternate instances listed here.
- Click Create a map and pan/zoom in to the area of interest.
- Click the layers button (just under the +/- buttons) and then click Edit (the pencil symbol).
- In the right hand pane click Remote data and paste the URL we constructed in step 5 into the Url box.
- Select “osm” from the drop down Format list.
- Tick the dynamic checkbox.
- Optional: If you have a lot of data you may want to limit the display to certain zoom levels (so as to not put too much strain on the Overpass servers). You can do this by entering a min zoom level in the From Zoom box. Here I have entered 13 as my minimal zoom level.
- Customise using the options on the right. Here I’ve changed the map background to OSM monochrome and changed the colour of the overlay data.
- Click More on the left hand side, followed by Embed and share this map.
- Copy and paste the embeddable iframe (I also had to click Current view instead of default map view in the iframe options box.
The resulting map is shown below:
Inspired to create your own map? Let us know what you make by posting a comment below or tweeting us on @mappamercia.
OpenStreetMap alternatives to Google’s Maps Engine and Fusion Tables
Often we just want to produce a simple map showing data as a collection of pins (map markers). In this post we look at two tools that both use OpenStreetMap base maps; namely geojson.io and uMap. These are both potential alternatives to Google Maps Engine and Fusion Tables.
OpenStreetMap has come a long way in the last 10 years; we’ve reached 1.7 million registered users, over 300,000 of whom are the last editor an an object in OpenStreetMap, and we’ve contributed over 2.4 billion nodes (points) and 248 million ways (linear features). This has led to OpenStreetMap being deployed by large companies such as Apple, Mapquest and Foursquare, and relief organisations such as Médecins Sans Frontières.
However when it comes to individuals – including those who associate themselves with the Open Source or Open Data communities – many people stick with what they know. More often that not that’s Google. OpenStreetMap is quite different; as it’s not a traditional company, most of the interesting stuff is going on outside of the core openstreetmap.org website. Let’s look at two online tools that use OpenStreetMap for the base map display.
Geojson.io
Geojson.io describes itself as “a quick, simple tool for creating, viewing, and sharing map”. It has a strong focus on input/output (io) as it supports major formats such GeoJSON, KML, GPX, CSV, TopoJSON, amongst other formats listed on the OpenStreetMap wiki. The inputs can be from a file, from a GitHub (including Gist snippets) or added manually via the website’s user interface. The final map can be exported to file, to GitHub or shared as an embeddable iframe or as a standalone URL. Visual customisation is limited to a choice of three map backgrounds.
Example:
In this example I have a geojson file of pubs in and around Stratford-upon-Avon. All the data is as points (nodes) and I want to produce a simple map to display in this blog post. Using geojson.io the steps are:
- Go to geojson.io.
- Click Open and load the source file. The map data can then be edited in the right hand pane (I used the table edit to drop some columns)
- Pick a map background from the choice of Mapbox, Satellite and default OSM from the options in the bottom left.
- Click Share and copy and paste the embeddable iframe.
Here is the result:
Quick, simple and effective.
uMap
Similar to geojson.io above, uMap describes itself as a way to “create maps with OpenStreetMap layers in a minute and embed them in your site”. It supports a number of import formats including geojson, csv, kml and also allows you to draw content directly on the map. On the export side, you can download the map data in three different file formats, or share it via an embeddable iframe or stand alone URL. Unlike geojson.io, uMap has numerous customisation options, for example you can pick from 16 map backgrounds, map data can be styled with a colour, fill opacity and line type, and the popup content can be adjusted to display additional information such as images and web links. uMap also enables you to easily work collaboratively on a map. This flexibility does however make the user interface more complicated than geojson.io’s.
Example:
This example uses a file of school locations in and around Lichfield. Most of the data is stored as polygons, however it also include point data. As before the aim is to produce a simple map to display in this blog post. Using uMap the steps are:
- Go to umap.openstreetmap.fr or one of the alternate instances listed here.
- Click Create a map.
- Click Import data (the up arrow icon on the right or keyboard shortcut Ctrl+I).
- Customise using the options on the right. Here I’ve changed the map background to MapQuest Open.
- Click More on the left hand side, followed by Embed and share this map.
- Copy and paste the embeddable iframe (I also had to click Current view instead of deafult map view in the iframe options box.
Here’s the result from uMap:
Advanced, customisable, and featureful.
Tell us what you think
Have a go and let us know what you think. How do they compare with what is available from Google or others, and what would make them better. Drop us a line in the comment box below or via our twitter account, @mappamercia.
Tell us: Where is the Midlands most unusual listed building?
Here in England we are lucky to be surrounded by many historic buildings , and indeed our heritage is a big attraction for local and overseas tourists alike. To ensure that the most significant of our historic buildings are protected for future generations to enjoy, a building may designated as a “Listed Building”. Once on this register a building has statutory protection and may not be demolished, extended, or altered without special permission from the local planning authority. The register, which is maintained by English Heritage, is published online and we’ve also produced our own heritage map for the West Midlands using this data.
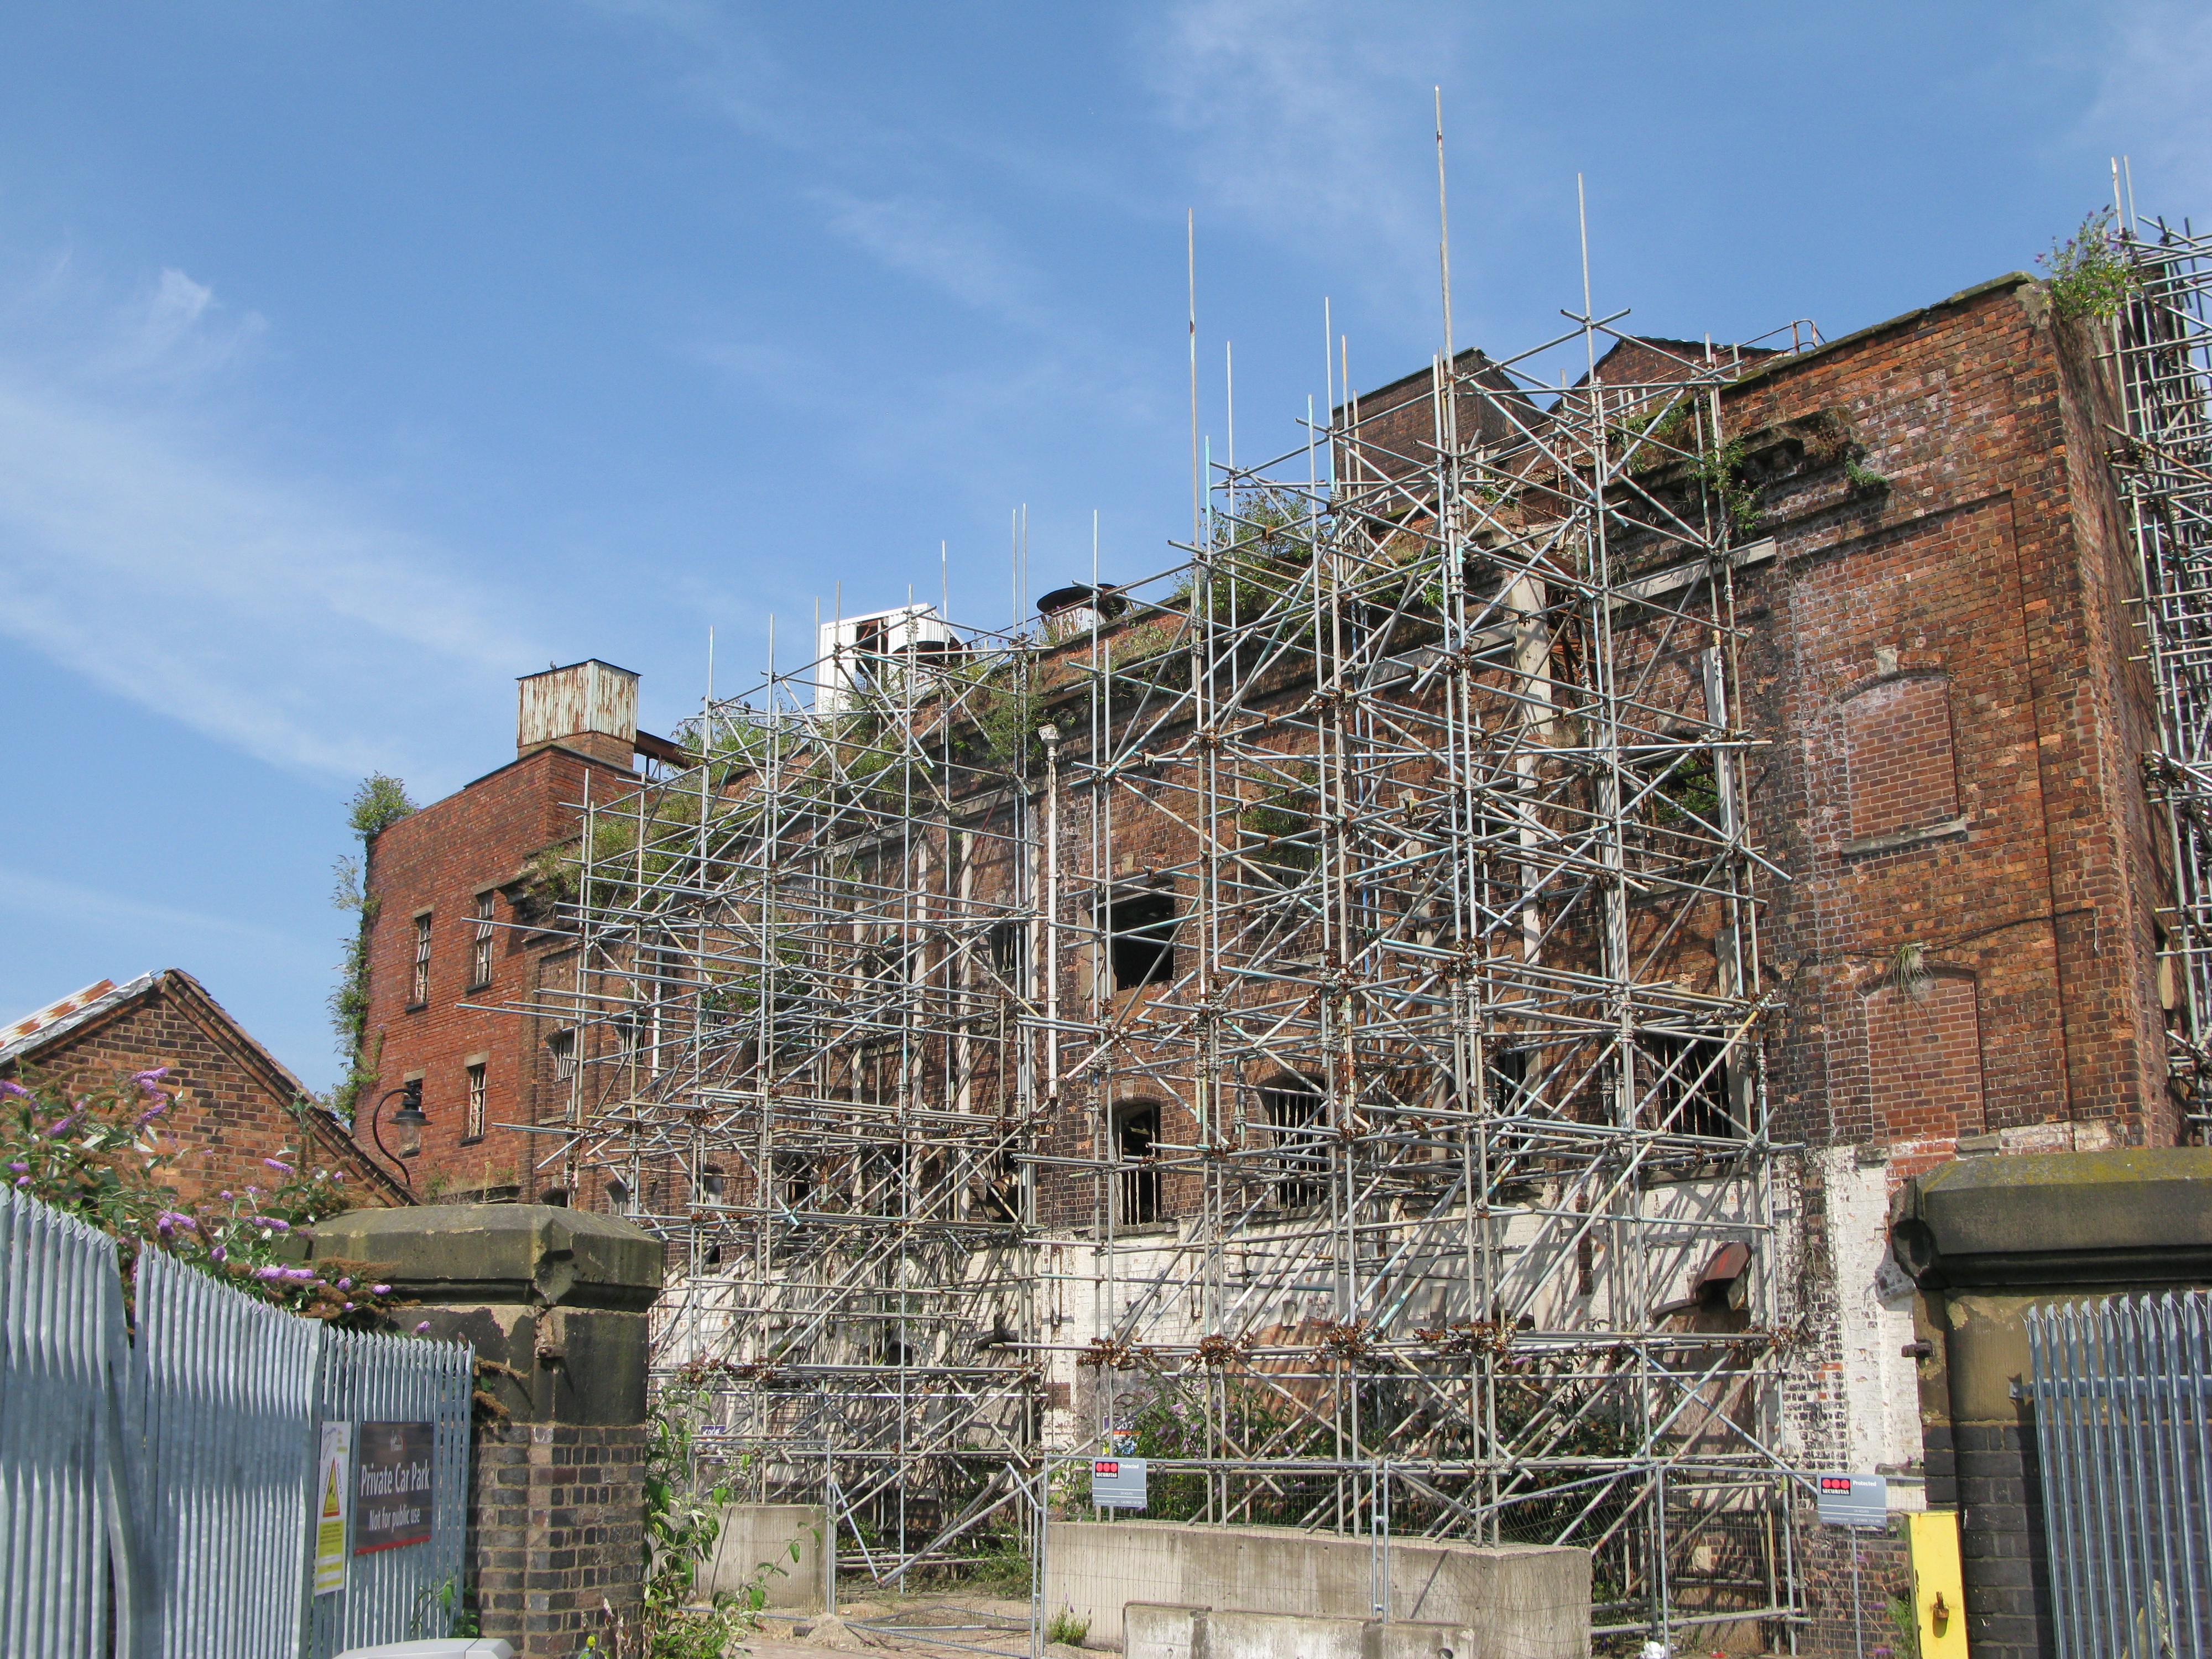
It’s very expensive to own and maintain a listed building, so unfortunately a significant proportion of them fall into serious states of decay. This is the Old Steam Mill in Wolverhampton not far from the station:
Many buildings and structures do not make it through the rigorous selection procedure to become listed, but still have some architectural or historical interest, so local authorities maintain “local lists”. Locally-listed buildings do not have statutory protection so developers can do what they like with them, often demolishing them; but local planners will use all their powers of persuasion to preserve them. For example, Coventry’s local list can be found here.
“It has six wide ‘zebra’ stripes painted in white onto the Tarmac road surface, flanked by two lines of dashed marks either side…”
“Buildings” is perhaps a poor description, for the register can contain any historic structure. In the Midlands for example we have listed bridges, milestones, canal locks, telephone boxes, sewer ventilation pipes, tunnel entrances, fountains, bandstands, statues and monuments. Meanwhile in north London the Abbey Road zebra crossing – made famous after appearing on a Beatles album cover – was added to the register of listed buildings and structure in late 2010.

There are also some very interesting structures to be found in local lists. Wolverhampton City Council has locally listed “Margery Cabinets”: these are electricity distribution cabinets designed by T.A.G Margery, the then Borough Electrical Engineer about 1930.
Today we’re asking you – where is the Midlands most unusual listed building structure? We’re not limiting it to just Birmingham, or just the West Midlands; feel free to explore the outer edges of the Midlands. If you think it counts, we want to hear about it. Drop us a message using the comment section below, or contact us @mappamercia on twitter. A picture would help enormously.
A missing ‘l’ adds 5 miles
When I first started contributing to OpenStreetMap there was a Project of the Week section on the OSM wiki. After much success this eventually came to and end in July 2011. Now, after a three year break, its back in the form of a “wochenaufgabe” (weekly task), for it is the German OpenStreetMap community that has brought back this weekly project.
This weeks task revolves around adding street names to buildings and suggests contributors use the Geofabrik OSM Inspector tool I previously blogged about. Given that I recently helped to map buildings as part of our Shenstone meet-up, I thought I best check the quality of our evenings work.
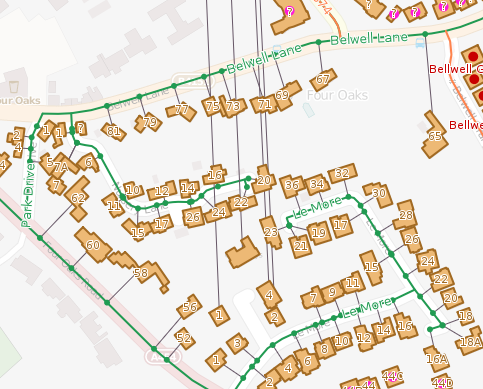
As it turns out, my attention was quickly diverted to the neighbouring town of Sutton Coldfield. As shown in the image above there are a collection of houses in Four Oaks that have a street name that links to Aston Close in Shenstone, 5 miles north (as seen by the lines heading north from each property). The buildings are tagged with addr:street=Aston Close, whilst the nearby Sutton Coldfield street is tagged name=Alston Close. So which is correct – Alston or Aston. We could go back out an survey this close, or turn to OpenData in the form of Land Registry’s Price Paid data.
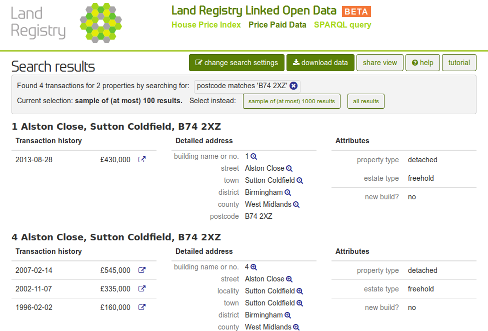
A quick search of the Price Paid data identifies the Sutton Coldfield street as Alston Close. No longer will you end up 5 miles out of the way next time you use OSM to route to this street.
Checking for errors in address data
I’ve slowly been getting in to mapping more residential addresses in OpenStreetMap. In theory this sounds quite an easy task – you have an odd side and an even side of the road, and you count up in 2’s. In practice it can be a lot more complex. Some of these complexities can be quite common, such as skipping number 13, but you also get other missing numbers, double numbers (e.g. 20 and 20A), and houses that disappear round the corner.
So how can I check that mistakes haven’t slipped through? Well, fortunately there are many quality assurance tools to check OpenStreetMap data. For addresses I find OSM Inspector works well. Let’s look at some examples:
Example 1: No matching street
In the picture we see that OSM Inspector shows the buildings, and adds an artificial line linking the building to it’s street (as tagged in OSM). In this first example there are three houses that don’t link to a street. The OSM Inspector tells me that these houses are tagged as being on Underhill Close, a name that is not present on the road nearest these houses.
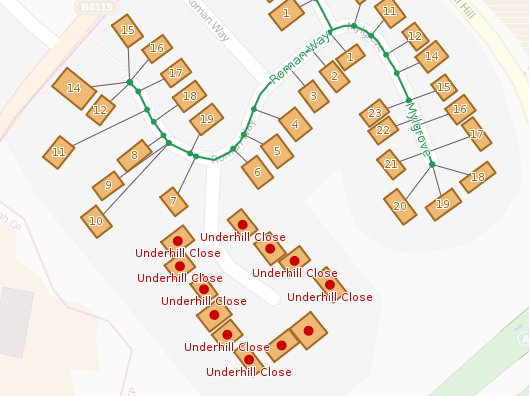
Resolution: The best option here would be to do a ground survey to check for the name on the street, and if you do this you’ll find a sign for Underhill Close. But what if a ground survey is not immediately possible – are there any other sources we can use? Well, we could look at the OS OpenData. I find that OS Musical Chairs is a good site to use. In this case though, the Ordnance Survey don’t have the Underhill Close name (link). Another source is the Land Registry Price Paid data. Using the search form (link), I find this street name in their database.
Example 2: Incorrect street name change
This ones a bit more suitable, but highlights the benefit of mapping residential addresses. In the example the street name changes from Throckmorton Road to St Mary’s Road. I had originally mapped the transition of street name at the intersection with Winchcombe Road (to the north). My adding the addresses it is clear that the transition between street names actually occurs further to the south-east.
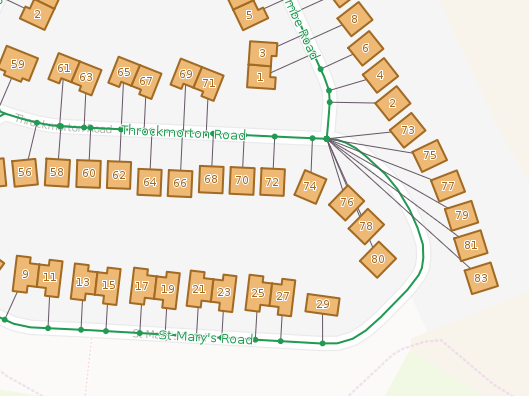
Resolution: In this case we can just change the point at which the street name changes in OpenStreetMap. Somewhere in the south east corner between numbers 83 and 29 will be fine.
EDIT: Why not take a look at what OSM Inspector shows in your neighbourhood.