Welcome again to Mappa‑Mercia.org

posted in: Participate, Use The Map | 0

Welcome to our new website. It’s taken us over a year to discuss, design, write and migrate from our old one – but we do have the excuse of organising OpenStreetMap‘s international conference State of the Map 2013 in Birmingham in September 2013. A not inconsiderable task which quite naturally took almost all of our time and energies. So good luck to the organisers of SotM 2014 in Buenos Aires and those organising regional conferences in Europe and the US – we know how much hard work it is!

Screenshot of our new website. Keep an eye open for more improvements in the coming weeks.
A screenshot of our new website. Keep an eye open for more improvements in the coming weeks.

Anyhow back to our website. We hope you like it. We’ve tried to give more prominence to the social element of mapping and given slightly less prominence to maps. It’s also displays great on tablets and smartphones. We have plans to enhance its content over the next few weeks.

And our blog is now re-open for business so expect regular updates from the Midlands – they might revive pleasant memories for those of you who attended SotM 2013 in Birmingham. We hope they inspire local mappers to continue their sterling efforts.

Rural Mapping

posted in: Participate | 1

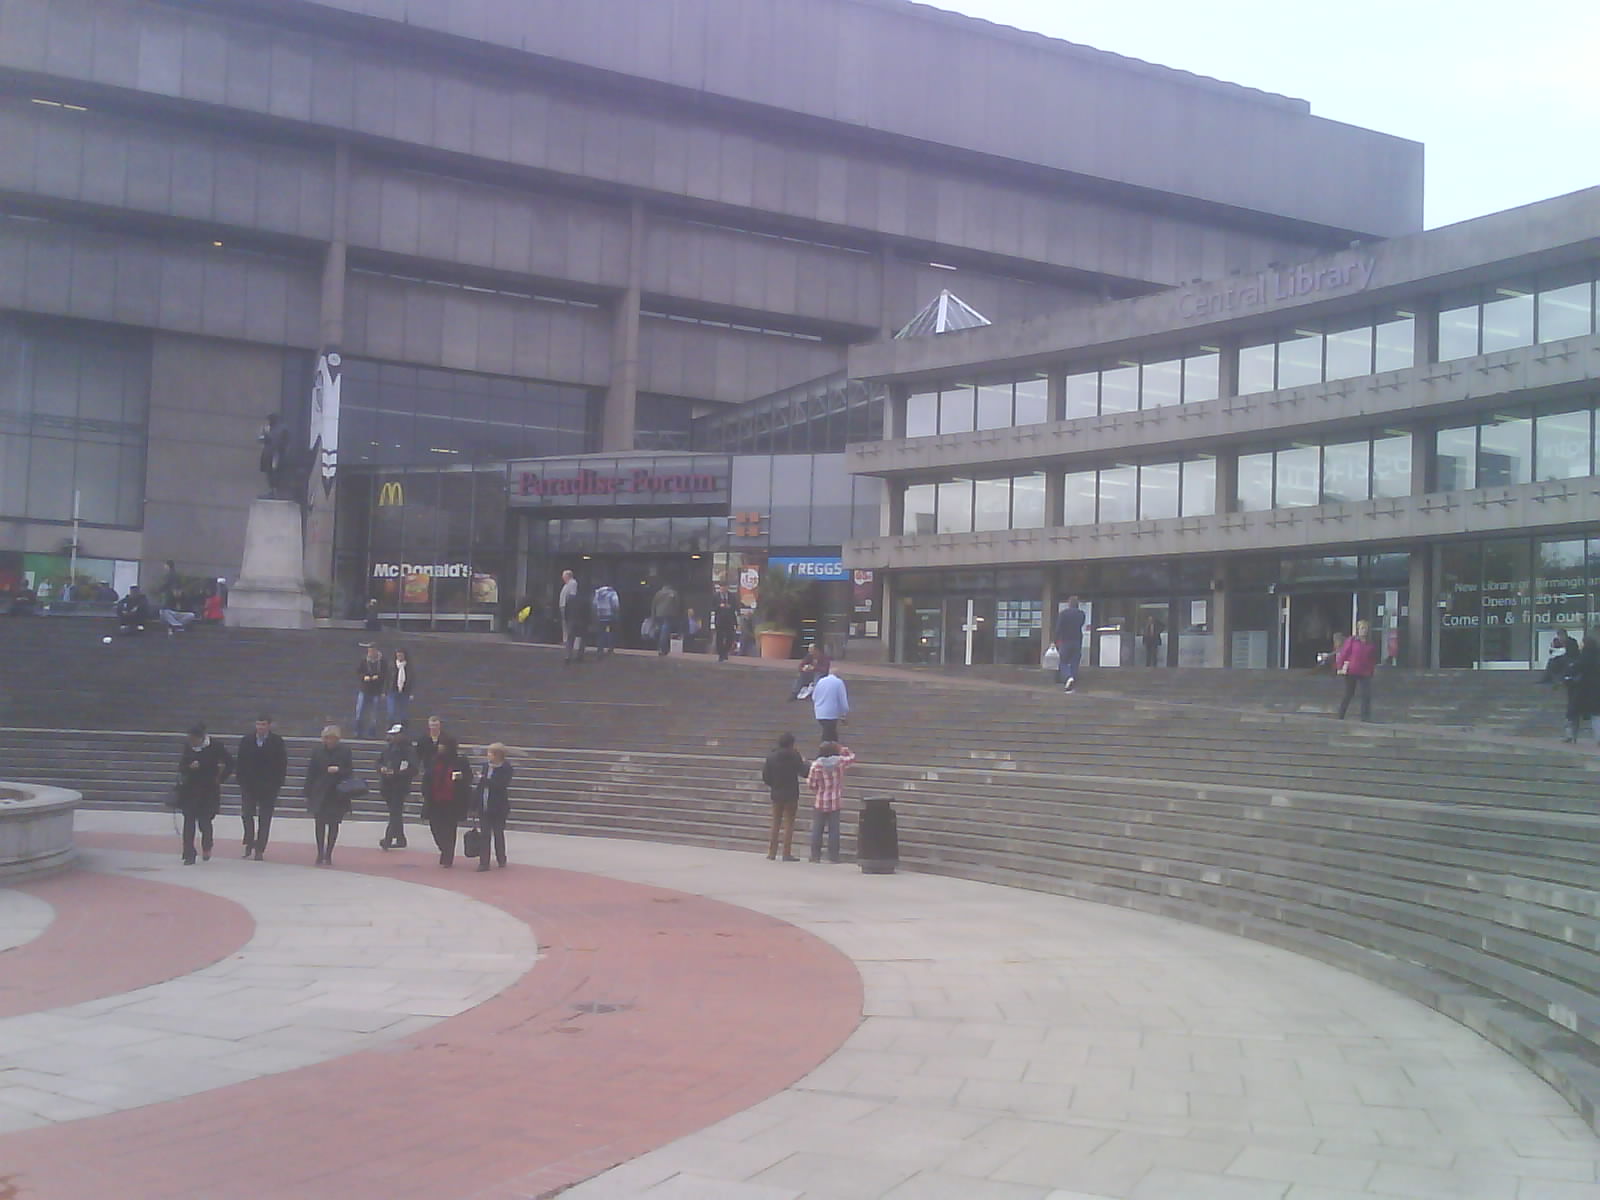
In the West Midlands we’ve been busy with rural mapping. To those of you surprised that there’s any countryside in the sprawling industrial conurbation that spreads from Wolverhampton through Birmingham and Solihull into Coventry, we need only quote the motto of Solihull which is Urbs in Rure (Town in Country). You will see that there is a large amount of green belt land that has been jealously guarded by planning authorities. The green belt land provides much needed recreational access for the surrounding population. It will come under increasing pressure from the new relaxations on planning restrictions.

In a COUNTRYSIDE TRIAL AREA to the eastern end of Solihull and the Western end of Coventry bounded by A45 / Birmingham Road Meriden / Berkswell Road / Meriden Road / Coventry Road / Broad Lane / Eastern Green estates / Allesley Green estates, mappa-mercia mappers have collaborated to produce a rural map to the most detailed level currently available within OSM.

Guidelines

The guidelines which we evolved by discussion, some concentrating on mapping landuse and others on mapping footpaths, are as follows:

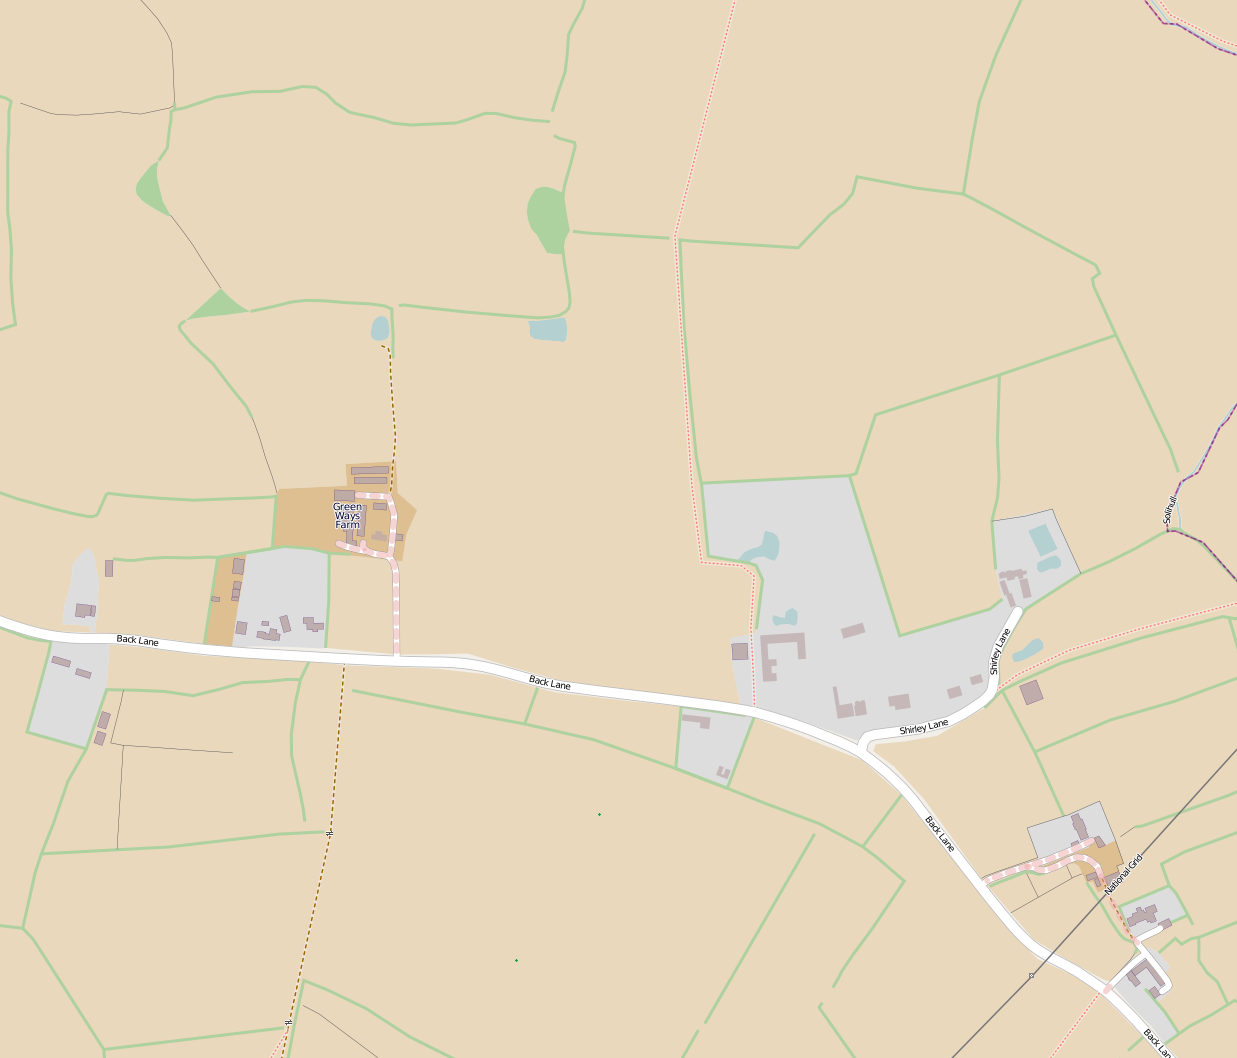
1. All field boundaries are shown using the predominant feature defining it to someone in the field. The most useful are: 
– barrier=hedge
– barrier=fence
– waterway=stream (NB: if a stream also has hedge one side and fence the other we only show more than one if it is necessary to make situation clearer).
– highway=service (or higher – only show barrier as well if necessary)
– boundary between landuse=residential and landuse=farmland (NB – these are not so easy to see and therefore adding a barrier as well is desirable, or for “MapQuest Open” type rendering, essential.

2.   Adding the main buildings within a residential area is desirable in order to give as god idea what the area looks like. We  have tried to add all houses, and usually all similar sized or larger buildings to all small areas of landuse=residential. In some cases we have added all buildings and the dividing hedge/fence between plots, but regard this as optional and maybe overkill/over use of memory/rendering-CPU-time/etc. In larger residential areas such as Meriden and Berkswell we have not added any buildings to contrast village with hamlet/mansions/etc., but would welcome other local editors to take on such tasks over time. In larger areas still, it is obvious by adding all the residential roads that the grey area is residential. Buildings for farm use are default labelled as building=agricultural, unless the specific use is known, e.g building=glasshouse

3.   We have  tried to give a landuse to all light grey areas other than the verges of roads and some tracks and footpaths. Sometimes this needed lateral thinking to define an area by its major use to avoid leaving light grey bits of scrubland, etc.

4.  Being surrounded by large residential areas where horse riding is popular amongst the residents there is  a large amount of farmland devoted to grazing and exercising horses: these we have differentiated by using landuse=meadow. It is often hard to get this right, for example the meadows north of Pickford Grange Farm are usually full of horses, but checking with Google StreetView shows cattle in the eastern 2 or 3  so we’ve left them meadow). There are other areas which are probably anomalies but regular ground surveying and more discussion will eventually clear these up.

5. Landuse=forest has only been used where it is obvious by the regular pattern of the trees that it  is a planted and managed area of trees. All other wooded areas are tagged natural=wood. Currently we are not sure that we have been totally consistent here. There can also be ambiguity between a line of trees, a thin wood and a thick hedge,especially along watercourses. Much here is a matter of styles between individual mappers.

Issues

A. The brown colouring of the farmland we hope one day soon be made lighter/brighter. The current brown is not, to us, aesthetically pleasing, and  makes seeing highway=footway paths hard to see. The residential grey has almost as bad an effect. 
It may be a good idea to render footways somewhat wider (especially at larger scales), and/or increase the width of lightening the background which works so well with woods and forests.

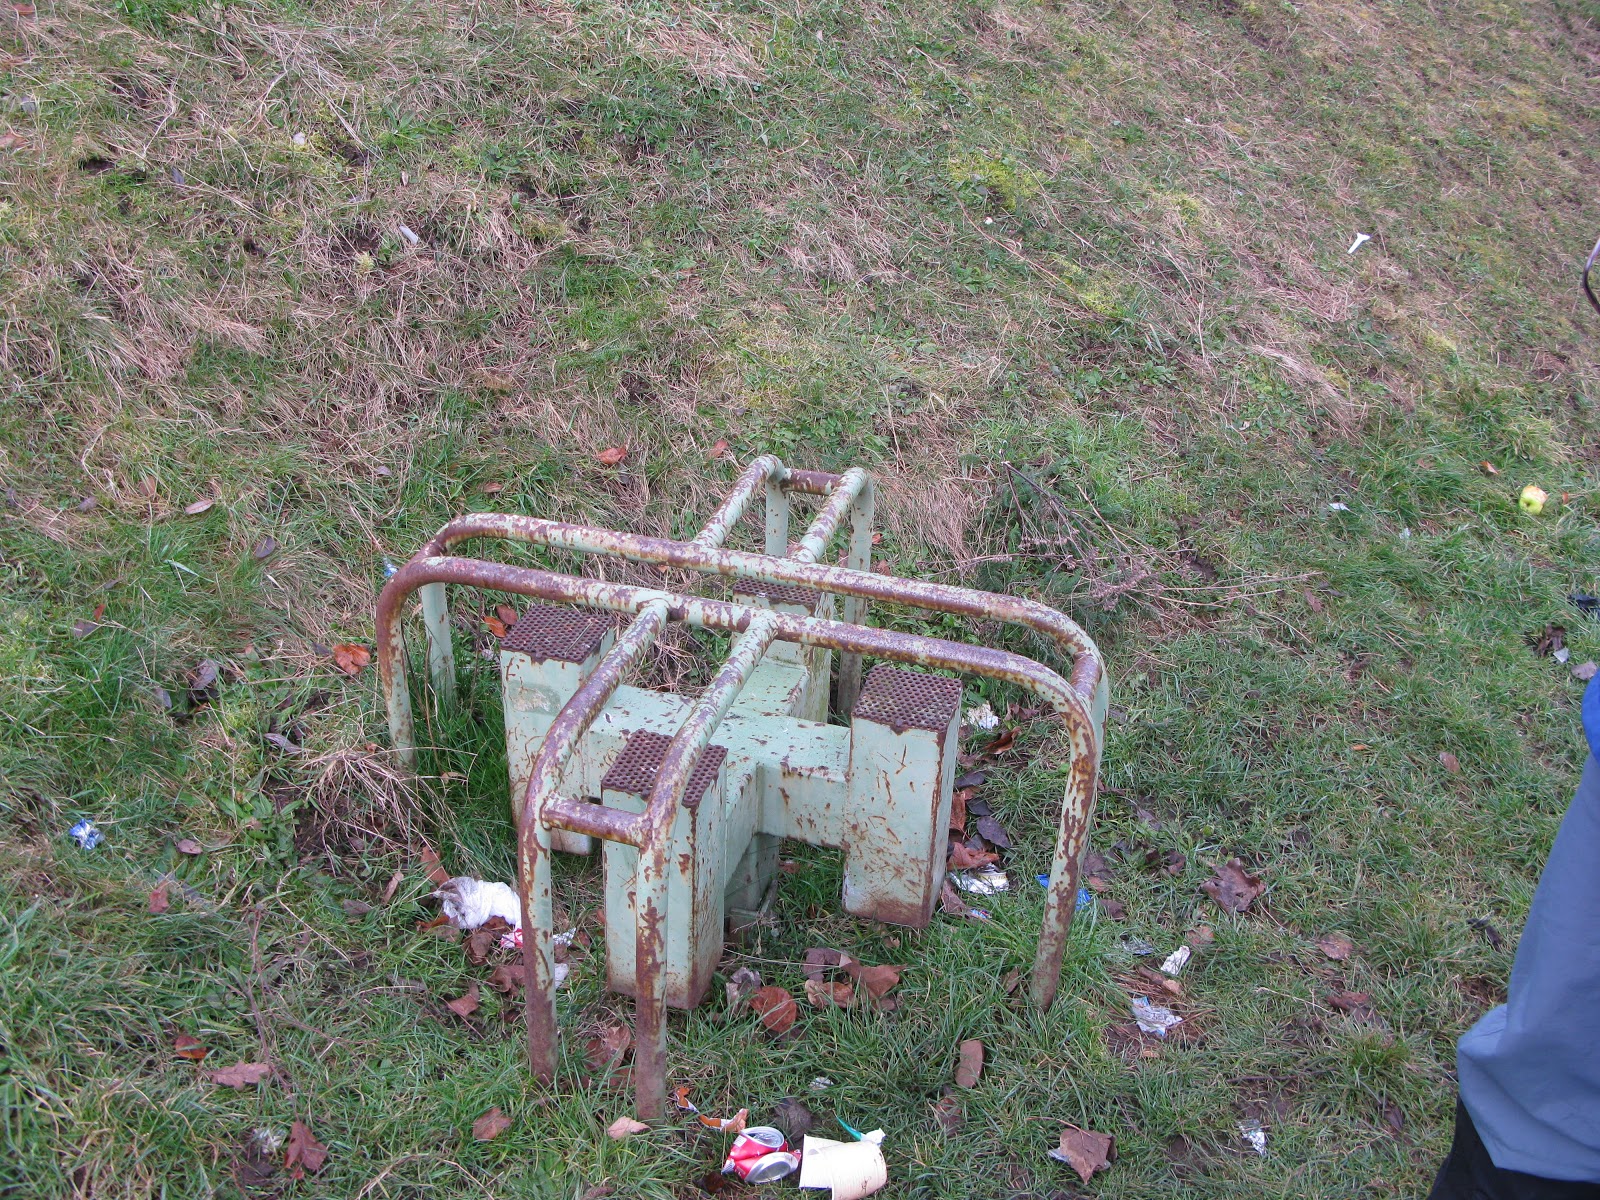
B.  We have been adding a lot more of the stiles and kissing gates. Unfortunately the latter do not get rendered whereas gates, bollards and stiles do. Kissing gates locations are useful to know if you need to navigate with persons who can walk adequately but have mobility difficulty in crossing stiles or you have a very large dog which you can’t lift over stiles bit you can get though kissing gates. We can’t rely on the absence of stiles on the map to infer a walkable  route in these circumstances (incomplete surveying), but the explicit rendering of kissing gates would be a great asset.

Heritage mapping

posted in: Use The Map | 3

Finally, after a couple of years surveying listed buildings, parks and gardens an public artworks, amassing along the way a vast collection of photos; we’ve managed to get a prototype map showing everything of “heritage”  or “cultural” status in the West Midlands.

There doesn’t seem to be anywhere with one source that you can go to to visualise all this data and how each point relates to another. You can search and find individual points which is time consuming and requires some prior knowledge. But once you’ve found an interesting artefact you’re at a loss to know what else is close by, so that if you plan a visit you might miss something just as interesting nearby, or fail to put your chosen artefact into its proper context.

The data is a mixture of OSM data and government data from English Heritage. The English Heritage data is what we’ve come to expect from government data – it’s about 95% accurate and about 95% complete (not a mathematical analysis just a “feel” for the data based on errors discovered so far). Getting that last 5% just seems to be too much effort and too much expense! But thanks anyway to English Heritage for finally publishing the data under an open licence.  OSM data was extracted using osmfilter and then converted to csv format using osmconvert -two very useful tools, even if getting used to a command line interface was a bit tedious at first – so congratulations to the authors.

We’ve used TileMill and MapBox mainly because of the excellent initial free hosting and the ease of learning the editing tools – still a steep learning curve but nowhere near as steep as some map-making tools. TileMill has its limitations but it’s a great introduction to keen mappers who are not skilled software developers. So congratulations to MapBox and don’t worry about it looking daunting once you’ve started:  their support is excellent and not at all condescending to newbies.

This is what it looks like and you find the service here.

Our service is still evolving and is nowhere near fully populated – most interesting feedback so far is the level of satisfaction with the pop-up boxes being set to the side of the map not over the marker, obscuring the surrounding area. We’re hoping to get local conservation bodies interested and one has already responded positively.

Mapping transverse steps

posted in: Observations, Participate | 3

How do you map steps that are transverse like these? This is a view towards Birmingham Central Library from Victoria Square and is a route traversed by thousands of people a day.

Currently highway=steps is for a set of steps along a linear way which doesn’t address this scenario which must occur tens of thousands of times across the planet.

There is a tagging proposal which as been around for a couple of years which seems to be going nowhere. I’ve read it and it’s far too complex for  me and I would guess most mappers.

Solving this problem is important a) for accurate mapping and  b) for disabled/visually impaired routing.

Perhaps a simple tagging scheme of highway=steps steps=transverse with the left hand side of the way being the top with a rendering of the current steps render with little arrows pointing in the downwards direction across the way?

While we’re at it perhaps the existing linear steps render could be improved with an arrow indicating down? But maybe that would be confusing with the one way render for streets/roads.

Mysterious Objects: No 2 of an occasional series

posted in: Observations | 5

This object has been a puzzle for a couple of years. It’s been constructed on land alongside an old railway siding adjacent to Small Heath Bridge Birmingham B11. This picture was taken from a train on the way into Birmingham Moor Street.

It’s pointing vaguely westwards, i.e which is the direction the camera is pointing in. The reverse side is a  highly polished surface (stainless steel?). It looks like it might be a solar collector of some kind but there are  no power cables or fluid/gas pipes that I can see so it remains a mystery.

Any offers of what it might be?

November Pub Meeting

posted in: Mapping Party | 0

We had a good turnout last night in the Spon Gate in Coventry – nine people, including  three new faces. A special welcome to Florian who’s just arrived from France for a long stay, working in Coventry. It was a good choice of pub with some excellent choices of beer made tastier by their low cost – well done Wetherspoons!

Our discussions ranged widely and randomly as usual, including: aerial photography, postcodes, quadrocopters, bridge relations, postcodes, listed buildings, footpaths, blue plaques, postcodes, SOTM, memorials in cemeteries and parks, postcodes, tagging businesses, public bodies’ open data, plans to improve our building definition inside the Ring Road in Coventry, Natural England open spaces and all the other topics at the other end of the table I couldn’t hear.

We didn’t just idly chat, we also made some plans:

  1. To keep the momentum going from the completion of tracing buildings in Birmingham we decided on collaborative armchair mapping of the buildings in Balsall Common – a large dormitory village midway between Coventry and Birmingham.  Maybe it will motivate some of us to travel there to do some surveying. We’ll have to remember to get off the train at Berkswell ( named after the next village to Balsall Common, even though the station is not in Berkswell  but Balsall Common – such is the logic of naming of stations!)
  2. Next month we all felt we’d like a curry rather than a pub meet , which soon progressed into “Let’s map the Balti Triangle in Birmingham”. Now the Balti Triangle can probably be surveyed relatively speedily, so we soon expanded the mapping objective to the Bus Route 37 which can be boarded outside Moor Street Station and will take us to the edge of the Balti Triangle. So the party will be dubbed “Mappa Mercia 37” and will take place on Saturday December 1st with mapping for as long as the weather and stamina allows until it gets dark – say 4:30 where we’ll meet in a pub (bit of a challenge since the area is mostly muslim and most of the pubs have closed!) and then proceed for an early evening curry. Cake based on No 37 bus stops will be up shortly.
  3. SOTM 2013 bid – numerous decisions based on keeping up the momentum which will be communicated separately to Talk-GB.

If I’ve missed anything apologies and let me know so I can add it.

Birmingham completely covered with buildings

posted in: Map Improvements | 3

Today West Midlands mappers have  passed another major milestone: Birmingham has complete coverage for buildings!

Complete coverage does not mean we have EVERY building mapped, just that we’ve covered every area of the city. There will be the inevitable errors from buildings having been built and demolished and just from human error in missing a building. We welcome news from  the keen-eyed of any errors so we can improve the map even further.

It has taken two years of effort (often very tedious) tracing buildings from our own aerial imagery (supplied by Cities Revealed for the City Centre) and latterly from Bing. For new developments (new housing estates, industrial estates, supermarkets and demolitions) we have had to compare Bing with the latest release of OSSV which is newer and reveals a later state of building coverage. Nevertheless we reckon that we have the most accurate and complete coverage of any online map of Birmingham.

While we’ve been at it the other local authority areas in the West Midlands have also obtained pretty good building coverage. Estimates are:

Solihull
70%
Sandwell
30%
Coventry
20%
Dudley
10%
Wolverhampton
10%
Walsall
10%

Thanks are due to everyone who’s contributed – especially the 6 or so mappers who have contributed most of the work.

For those of you reading this outside the UK who might be thinking “ What’s the big deal?” every building has been traced by hand – we have no data import of building outlines available to us.

You can see a good visual analysis of coverage by using the excellent tools at ITOworld’s map service.

Of the 290,000 buildings added, 69,000 have full address information, complete with postcode.

The building count we estimate is under-represented by a factor of 8, as many are just represented by an outline rather than individual addressable units. For instance, a row of terraced houses of which Birmingham has hundreds, once surveyed and terraced with individual addresses can become up to 40 buildings, depending on the length of the terrace instead of one. This all depends of course on your definition of building; but we’re basing this on OSM tagging of building=residential (or similar in other circumstances) for each address.

There are over 400 tags applied to buildings; here are some of the more prevalent ones:

Tag
Qty
Listed Building
1,400
Residential
137,000
Retail
2,000
Garage/Garages
4,500
Yes
134,000
Industrial
1,000
House
5,000

Amongst the bewildering variety of tags we even have a chimney mapped! This is probably an old industrial artefact of some prominence. Anyone want to try finding it? (The person who mapped it is exempt from this challenge!)

All figures are for the West Midlands as a whole rather than just for Birmingham, and are rounded to the nearest thousand.